")
")
")
")
")
")
")
")
")
")
")
")
")
")


Technical picture for the EURUSD pair in the Forex currency market
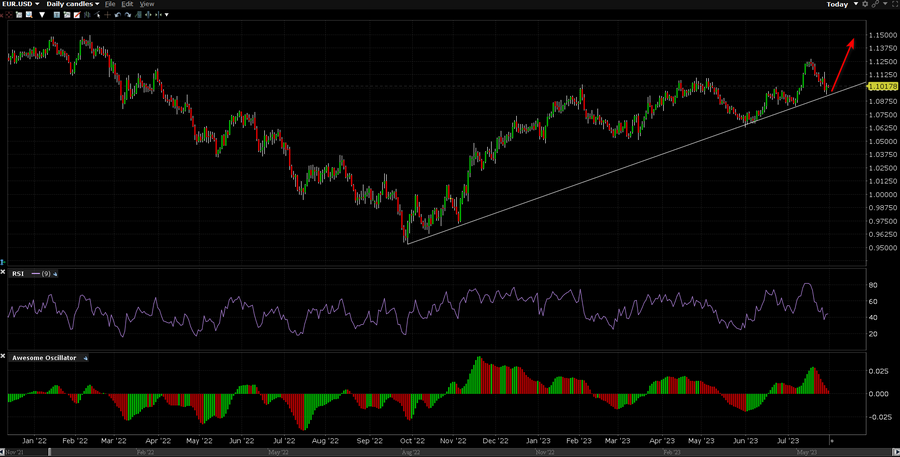
The euro weakened against the US dollar last week. However, the broader technical bullish EUR.USD remains in place. This is because on the daily chart below, EUR.USD has fallen to a short-term rising support line since the end of June. The last one was held last week, keeping the upward slope. A bounce off support draws attention to the 38.2% Fibonacci extension level at 1.1231.
A break above this point exposes the February 2022 highs, forming a resistance zone between 1.1453 and 1.1495. In case of a downward reversal, the next key support appears to be at 1.0834, the July 6 low. Behind it is the April low of 1.0635. Let's zoom in on the 4-hour chart to get a closer look at where the short-term price action could go.
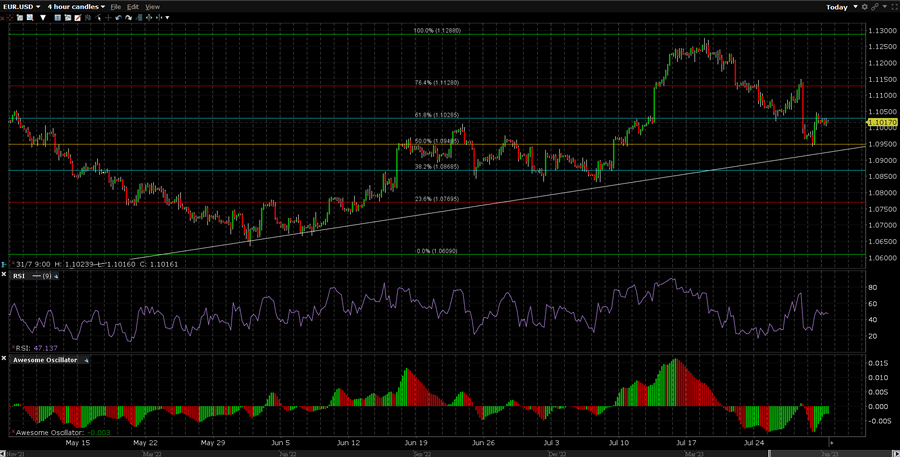
In the 4-hour chart below, we can see that right before the euro bounced off rising support since June, a positive RSI divergence was brewing. This is a sign of fading down momentum, which can sometimes precede a reversal to the upside. In the case of a short-term up move from here, this will focus on a potential drop in the trend line from the July high.
A break above this mark exposes a minor 14.6% Fibonacci retracement at 1.1182 before focusing on 1.12758. Just below the rising support is the midpoint at 1.0954. A break below this price exposes the 1.0833-1.0859 support zone. It consists of lows since the beginning of July. Further downward movement from there could open the door to a fall to the May low of 1.0635.