")
")
")
")
")
")
")
")
")
")
")
")
")
")


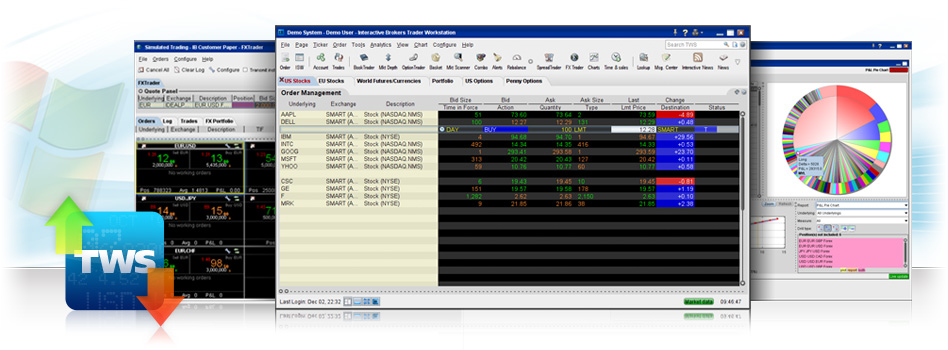
Trader Workstation
for professionals
Optimize trading speed and efficiency with our Trader Workstation (TWS) terminal that matches the market maker's level. Trade stocks, options, futures, forex, bonds and other exchange-traded contracts in over 200 markets around the world from one brokerage account.

Trader Workstation (TWS) Benefits
A simplified workspace optimizes order management for your requirements, manages analytics in the terminal, monitors the account and has other useful functions for successful trading.
News and analytics subscriptions from leading vendors that integrate seamlessly into the TWS workspace.
Real-time monitoring of trading activity and account, margin control system that informs about margin deficiencies and the possibility of liquidating positions.
Custom strategy solutions and enhanced trading tools for all trading styles: ScaleTrader, SpreadTrader, OptionTrader and more.
Risk and option price management systems built into the workspace.
Paper Trading, a personal demo account with real-time quotes, is linked to your main trading account, which allows you to experiment with the full range of TWS features.
Trader's workspace
Trader Workstation is a unique, comprehensive and efficient working tool for trading that allows you to effectively use all the necessary tools in the trading process and place windows on an individual basis.
Mosaic

Mosaic provides an intuitive workspace with quick and easy access to complex trading, order management, charting, asset portfolio view and more.
Classic

The classic workspace, together with the possibility of advanced order management, is available for traders in this version of the platform and allows the use of Algos and additional tools.
Functions and settings of the trading platform
Main features of Trader Workstation
Trader Workstation is a modern trading platform, the advantage of which is that it can be customized to individual requirements, which is a very convenient option and allows you to quickly respond to market changes.
When a client first launches Trader Workstation, he is offered a choice of one of two interface options:
Mosaic – new users are invited to choose, those who have not yet used this platform. A distinctive feature of this type is that it presents an intuitive workspace thanks to a set of combined windows.
Advanced order management - this type of interface is offered for those users who were previously familiar with previous versions of TWS. In this version, orders and quotes are displayed in a tabular format.
Once the client logs in, he can easily switch from one to another interface. Both of these interfaces allow you to use trading tools with built-in fields for order management.
And most importantly, do not forget to experiment, use different tools, combine them and select those that suit your trading style. Experts in the field of trading argue that such a seemingly insignificant aspect as setting up a platform plays a significant role in the success of trading.
To configure or change the set of tools or the interface, press the key with the image of a wrench.
First of all, we will look at the main components of the Mosaic workspace, which are configured by default. The core elements are a set of interchangeable tabs that can be easily combined, removed, added, and reconfigured individually.

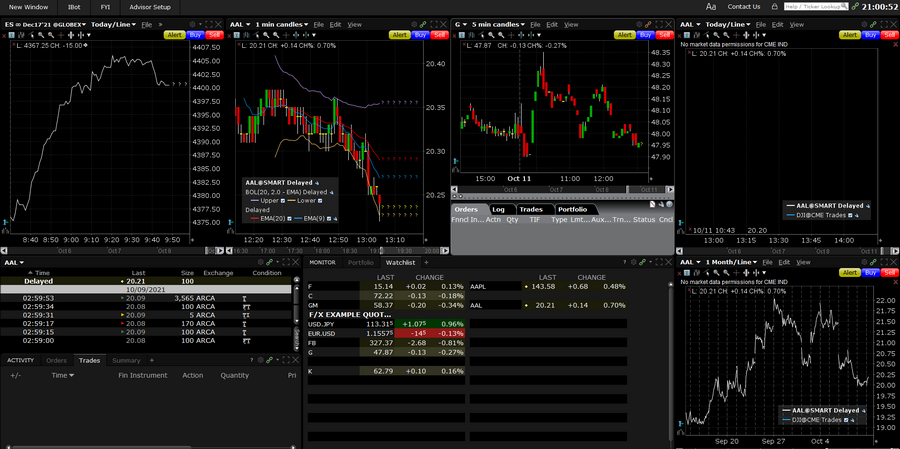
The workspace that appears to users as the initial one displays individual windows that are linked by color. These windows make it possible to quickly monitor the status of your profile, account and watch list. Also, each client has access to order management and withdrawal windows, which have universal functionality. All necessary information is displayed in interconnected windows and changes depending on the selected ticker.
A window is identified to which of the groups using a color indicator, which is located in the upper right corner of each window. Windows of the same color are elements of the same group, and this is a very convenient option. When the user selects one or another ticker, all of the same color, the windows are updated automatically:
- Window of orders.
- Charts.
- Subscription-based service windows.
- News and analyst reports.
- Event calendars.
The user can access context-sensitive help from anywhere on the platform. In order to get a hint, just hold the mouse cursor over the heading or column icon.
The wrench icon allows you to customize and combine windows as you wish.
Windows in this type of interface can be expanded to full screen by double-clicking on the window title. If you need to make the window small again, you need to double-click on the free title space again.
- Windows components
- Anchor toolbar
![]()
The docked panel is the center of the work area. In order to move the entire workspace, you need to hold and move the title bar with the mouse, or use the icon on the right to simultaneously minimize all windows.
The title bar contains the File settings menu and a help menu with documentation (which includes a quick start guide), as well as an account menu. This menu contains reports and other account management functions. This information is accessed directly, without requiring user authentication.
By double-clicking on the title, the window expands to its maximum size. Once the window is maximized, the component windows are also modified.
A Mosaic workspace in a locked state is a single group of elements, which prevents tabs and windows from accidentally closing.
If the user wants to change, delete, move or resize windows, they must first unlock the workspace by clicking on the lock icon. When the platform's eyes are outlined in green, it means editing mode is enabled.
The New Window key allows you to open program functions and optimized tools.
The search column is designed to search for ticker symbols of corporations and companies.
By subscribing to analytics from the best specialists, as well as to news resources, you can always stay up to date with the latest events, as well as display the received information directly in the platform.
To access analytics and news resources according to your subscription, you must click the buttons: Event Calendars, Analyst Research and News.
From the Account tab in Mosaic, select “Subscribe to Market Data/Research.” This will open the Trading Configuration/Research tab in Account Management. In this tab you can view and request a huge number of services that are provided according to the subscription. Many of these services can be used by each client completely free of charge during a thirty-day trial period.
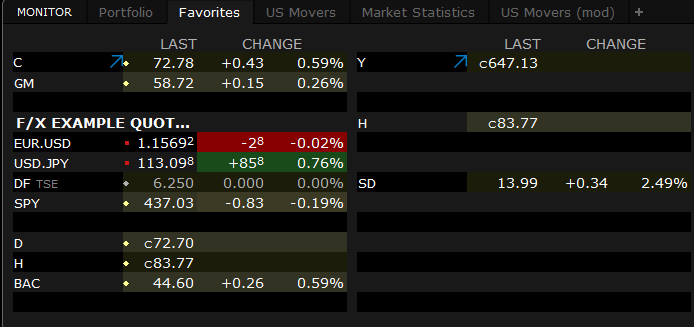
- Favorites – Watchlist (Favorites)
The favorites list presents a completed table that consists of several selected tickers. Each client can create their own watchlist by entering the ticker symbol as well as the asset class in the contract selection window.
The convenience of this table is that it contains several columns for monitoring tickers, and there is also a graphical visualization that adds information and allows you to quickly track the data received.
Options and stock tickers use consolidated market data "SMART" to route all orders. This function is designed to optimize the overall cost of execution. Its purpose is to ensure that each part of the order is executed on the exchange where the best liquidity and price are available.
The watch list shows the following data: transaction price with graphical points that visualize and demonstrate the direction of price movement.
Changes and % change - using this option, the trader can see the price since the last close of trading, and for greater convenience, there is a color indication of the background, which demonstrates the direction of changes.
By left-clicking on a ticker symbol, windows linked by color are updated: real-time charts, detailed quote details, news, etc. Data on the new ticker is displayed in all combined windows.
Right-clicking on a ticker will allow you to sell, buy or close a position. You can also launch any TWS trading tools. Among them are Market Depth, OptionTrader, FXTrader, or any other tool that contains data that the client has subscribed to - news, analytics, corporate earnings, financial indicators.
The convenience of this tool is that the content of the table can be easily adjusted to suit your trading style, namely by left-clicking on the column header. One click sorts the data in ascending order, a second click sorts it in descending order, and a third click returns the data to its original position.
You can also create additional watch lists during your work; to do this, click “+” in the window title.
- Quotation details
The Quote Details window contains data about the quotes of the underlying that the client selects.
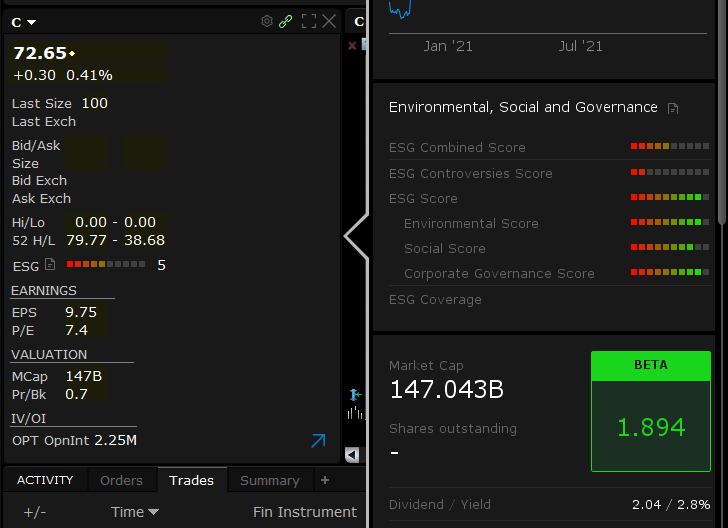
The cost of the last transaction has a color indication (tick dot) which provides information about the price movement. The background color also provides visual information.
NBBO data includes the following information: bid and ask price, today's high or low candlesticks and candlesticks that show the low/high of the last 52 weeks, today's trade volume and volume for the last 90 days.
Valuation – using this indicator you can monitor the current market capitalization, as well as the book value per share.
Income – shows the EPS and P/E ratio.
- Charts
Online charts, the same color as the selected ticker.
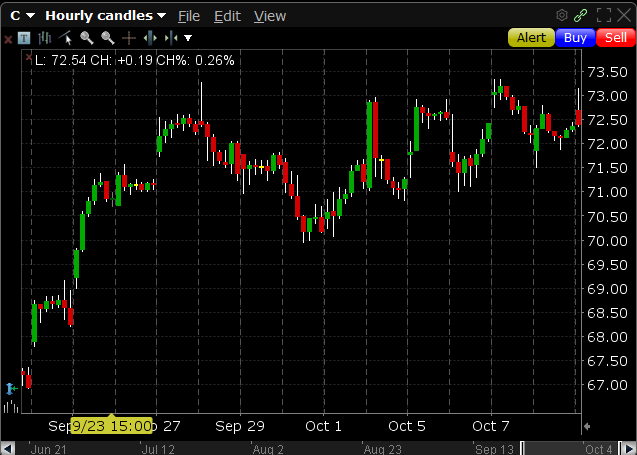
To change the time frame or chart template, you must use the title bar of the chart window.
The advantage of charts is that they are completely customizable. You can change the time frame, display volumes, add trend lines, as well as comments at your discretion.
Support for more than twenty installed studies and indicators.
Using the “Edit” menu you can add indicators, compare indices and study trend lines.
To change the time ranks to an earlier period, you can use the scroll line.
Right-clicking on the menu title gives access to absolutely all functions and the entire scope of the platform’s tools.
Using assigned hotkeys, you can send and create orders in the chart window.
Note to all traders: by double-clicking the mouse button in the title area of the thumbnail window, you can expand the window to the maximum; the next double-click returns the window to its original form.
- Tools
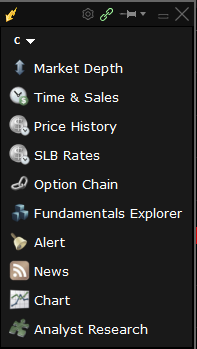
All trading instruments for the active ticker associated by color open in a separate window. These instruments can be closed and opened as needed. To dock a window on top of the workspace, use the pushpin icon.
The Price History window displays information as a list of prices in chronological order, showing open, low, high, close, and volume.
After clicking on the “Analyst Research” or “News” button, information on the selected company will appear in the window.
In order to select “Main Market News” or “Research” (which are not related to the ticker), you must use the buttons located on the docked panel.
Customers who prefer to work with right-click menus can close the toolbox window to free up desktop space.
- Daily selection
To open “Research” or “Main Market News” that are not related to the selected ticker, you need to use the buttons located on the docked panel.
Economic events. This section demonstrates events in chronological order: forecasts, real values and all the necessary data in real time.
Corporate income. Events from around the world that have connections to the client's portfolio companies and competitors.
"Todays Top 10" from Dow Jones. This section consists of the ten most important news items selected by the Dow Jones team.
Headlines and news. This section displays news that relates to products in the portfolio. This section is compiled by the Dow Jones editorial team, Reuters news service and other global news services.
- Activity Tracking
Activity on current positions, as well as transactions, is carried out using windows that are located on the right side. There are several windows in this platform space to make it easier for the client to manage orders and monitor trading activity.
- Briefcase
This dialog box displays your existing positions, market value, current prices, margin balance and equity.
Basic information about the account balance is presented at the top of the window and includes the following elements: the last price of each position, market value, P&L, percentage change in price since the end of trading the previous day and the average price.
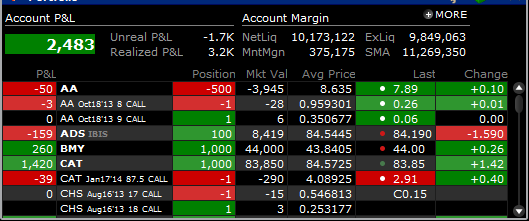
The “More” button opens the “Account” tab, which contains all the information about the account.
By clicking on the column header with the left mouse button, the sorting automatically changes: with the first click it is sorted in ascending order, with the second in descending order, and with the third click the information returns to its original position.
To quickly close a position, just right-click on the ticker and select the close button. The Order Entry window will contain information about the total number of contracts/shares held in your account.
- Entering orders
Using the order entry window, you can conveniently and quickly transfer and create orders. The compact window is color-coded and has context menus and drop-down lists that allow you to configure an order in a couple of clicks.
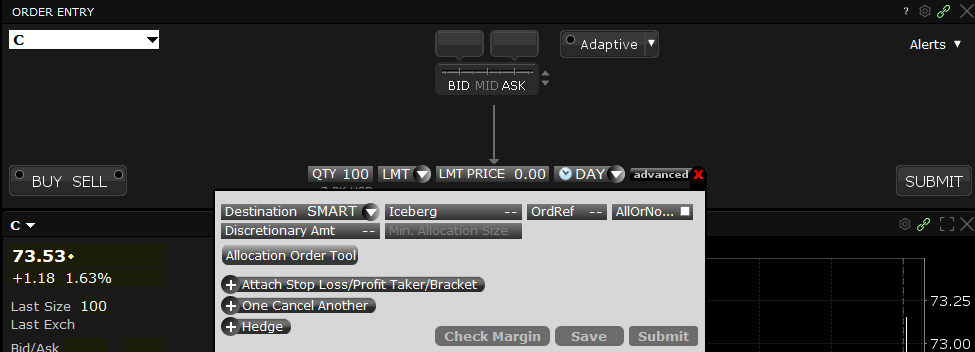
To start creating an order, you need to click “Buy” or “Submit”. In order to simulate the creation of orders, you can right-click on any of the tickers and click the “Close”, “Sell” or “Buy” button.
The line above shows the contract position and the actual NBBO value for the ticker.
To change order parameters: quantity, type, price, expiration time, you must select the desired parameter from the drop-down list or enter the required quantity.
When an order is submitted, a confirmation window appears (which can be disabled in the menu) to confirm the order parameters before placing it.
To add a stop loss, create bracket orders or profit takers, click the “Advanced+” button. The platform also allows you to configure “one cancels the rest”, “iceberg” and hedge orders, use other attributes, and also set the conditions of the algorithm by selecting Algo as the direction.
The “Check Margin” tab provides information about margin requirements before making a trade.
To set up default orders, click on the “Presets” button.
To open a window containing “Put” and “Call” options for the required ticker, click the “Option Chain” button.
Using the buttons located under the option targets, you can specify the routing expiration date, directions and strike.
Clicking on the “Create Strategies” button will allow you to create option spreads after clicking the bid or ask price for any option contract.
To add a leg with an underlying share, you must click “Make delta neutral” or “Add share”.
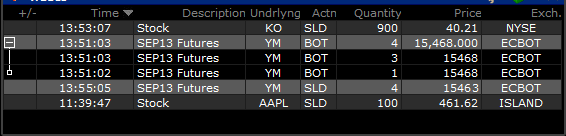
- Order Monitor
After the client has submitted an order, active orders can be modified and monitored in the Order Monitor window.
In order to change an existing order, you need to click on the field that you want to change and click “Change parameter”. After this, you need to click the O (update) button to commit the change. If you click the “Cancel” button, a request to cancel orders is sent. Tabs in the window title bar allow you to switch between activity tracking windows.
The “Orders” button is used to monitor and manage transactions that take place during the day. The “Orders” window, when setting the necessary parameters, allows you to configure the display of active orders, all orders, canceled or executed using the pop-up menu in the title of the dialog box.
The “Transactions” window contains information about current transactions of the day. To view the execution of lots or expand the summary line, click on the “+” icon. The
“Total” window provides information about the overall result of purchases and sales by ticker symbol, and complete information about the transactions of the trading session.
If these windows are not active, yellow icons for “Transactions” and “Orders” glow near the buttons on the title bar to warn the client about trading activity.
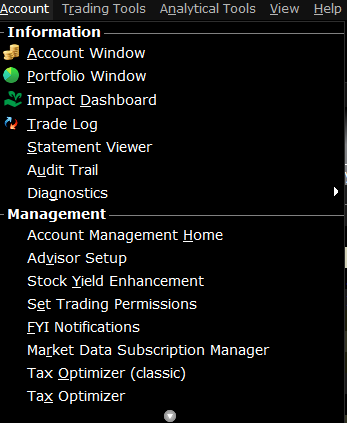
- Account menu
To provide access to Account Management options, an Account tab has been added to the docked panel. This menu allows you to view transaction reports and monitor performance risks without re-authentication. To open the full range of account management features and options, click on the “Home” menu – account management page.
To familiarize yourself with the margin requirements and view information about the account balance, click the menu item – “Account Window”.
- Desktop customization
To change, delete, add windows on the desktop, or change their size, just click on the lock icon of an unpinned panel. After clicking, the workspace is unlocked, as evidenced by the green outline of the desktop - editing mode is enabled.
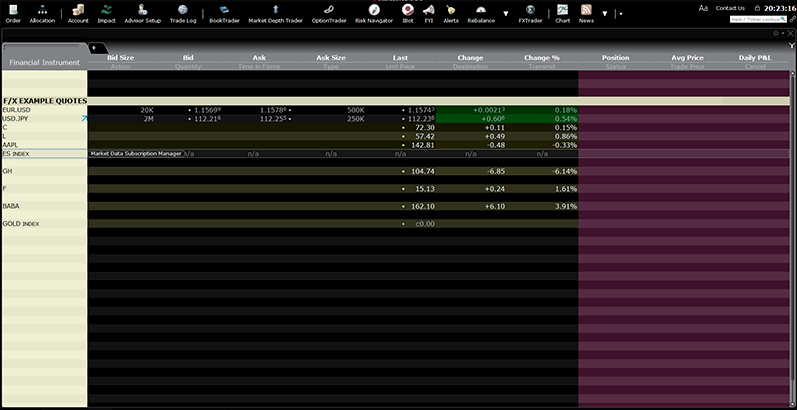
- Advanced order management interface

“Advanced Order Management” – Advanced order management is disabled by the “New Window” button. Using this interface, which is familiar to those clients who have previously used this platform, you can create more complex orders. For greater convenience, monitor bookmarks are presented in the form of a spreadsheet. Tables allow you to create a personalized trading environment that will fully meet your needs, without unnecessary detail.
Each bookmark page displays standard stock market readings, such as: last price, bid/ask price, closing price, etc.
To complete the market data row, enter the ticker symbol in the Contract column. There you will choose a direction and a tool. The data that appears in the columns will be updated in real time.
You can expand the market data graph. To track updated data about the current position, you can add the “Position” and “P&L” columns to the quote line. In this way, the market data fields can be expanded.
The number of tickers that can be added is not limited, but the client can only view one hundred quotes at a time.
For quick access to frequently used functions and tools, icons for these tools are displayed in the Toolbar. To add or change shortcut icons, click on the arrow button. This will allow you to quickly access frequently used functions.
If necessary, you can enable or disable the toolbar, button bar, etc., using the icons on the panel on the right side.
The data in the columns can be changed. Using the first click, the data is sorted in ascending order, the second click arranges the data in descending order, and the third returns the contents of the columns to their original positions.
To organize individual tickers, you can create a group header row.
The platform also has the function of creating hot keys. When you press Ctrl+H, a list of assigned hotkeys will appear, and you can change them and set your own.
It is very convenient that TWS remembers the settings of the last five days and by sequentially pressing Menu “File” | Open settings file, the client can restore the tickers configured during the last five days.
If you need to call context-sensitive help, just hold the cursor over the desired element. Context-sensitive help is available for all platform elements.
The platform menu displays frequently used features and functions. If there is an arrow at the end of the menu list, this means that there are additional options in this menu. Menu items that have not been used in the last 14 days disappear from the frequently used menu, but they are still available and can be selected by clicking on the arrow in the menu.
- Navigation
If you encounter any questions or difficulties while working with the platform, you need to click the right mouse button to open a context menu, the information in which changes depending on where the click occurs.
The “search field”, which is fixed in the upper right corner, will help you find the necessary functions and show the path to them. For example: enter the word “dashboard”, after which a special search engine will draw your attention to the desired tool or page, and will also visually bring the required element closer.
Right-clicking on a line of market data initiates the creation of an order, searching for information on that contract and accessing information trading tools by selecting them from the menu.
When you right-click on an order line, a context menu appears that allows you to pin dependent orders, monitor the accompanying margin requirements for the order before sending, create risk scenarios and weigh the risks themselves.
By right-clicking on the column header, you can request to display the values as a percentage or absolute value.
You can also use the right mouse button to configure rows, cells, buttons, etc.
- Trade
The “Quick entry of orders” menu allows you to create an order in one click on the offer or demand price in the active line, based on the parameters that are set by default. Settings can be changed immediately before sending an order.
The table called "Order Types" on the website lists over 50 different order types that are needed for various trading purposes. This menu gives detailed instructions on how to create any of the top orders.
“Order preset” makes it possible to create many strategies using default values and distributed by instrument type or by a separate symbol. To configure order presets, you need to right-click on the line of any of the tickers. You can also configure it through the menu Edit – Global configuration – Presets.
![]()
Installing and Downloading Trader Workstation
To install the Trader Workstation platform on your computer, click on one of the buttons below.
Download Trader Workstation Latest x64 Download Trader Workstation Latest x86
TWS Installation Instructions
To start downloading and installing the terminal, click on one of the buttons above. After pressing the key, the program will be loaded onto your hard drive and a dialog box will appear with a message about loading and saving the file. We recommend that you save the shortcut to your desktop.
The dialog box displays the estimated download time.
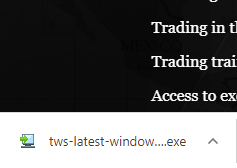
After saving the file to your desktop, click on the shortcut with the distributor called tws-latest-windows-x64.exe (as in the picture below).
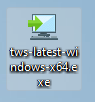
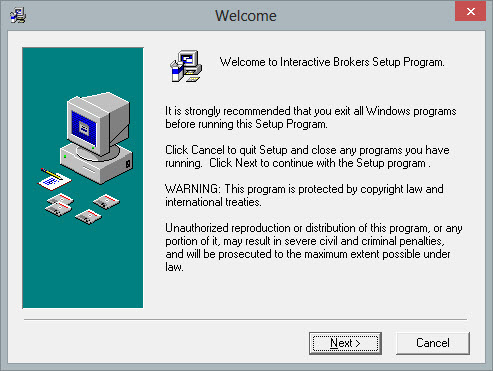
Click on the shortcut to start the installation. After opening the file, a security warning will appear in the dialog box, with which you need to agree and continue with the installation.
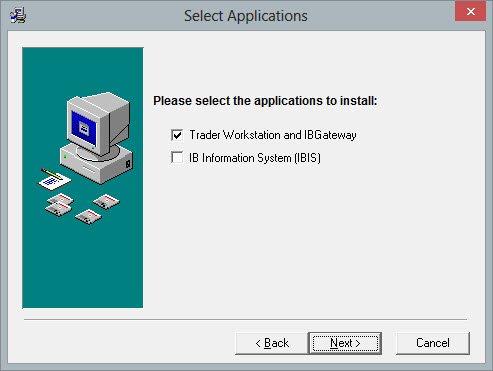
In the window, select the components that you want to install.
To install the terminal, check the box next to Trader Workstation and IBGateway.
If you want to install IBIS together with the terminal, check the box next to IB Information System (IBIS).
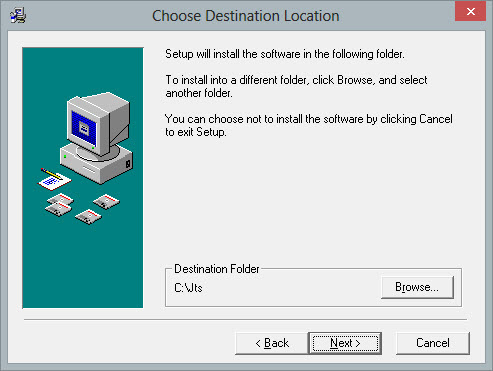
Next, choose a place to install the component. It is better not to change the installation folder. To change the save location, click Browse and select the save location.
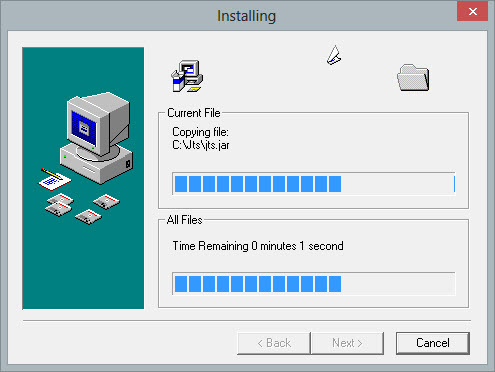
This will bring up a dialog box showing the progress of the installation.
Click Finish to complete the installation.
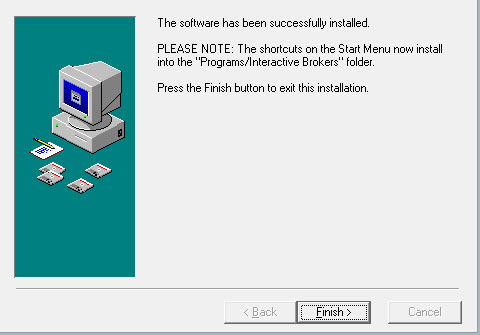
When the installation is finished, a shortcut will appear on the desktop depending on the version installed.

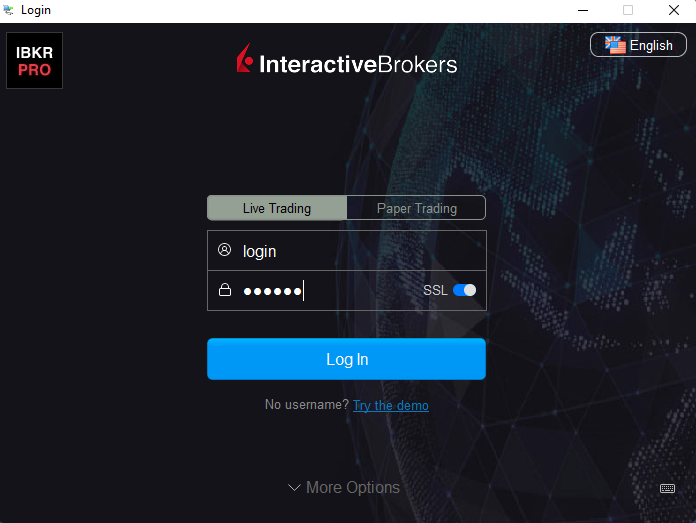
To log in with your account, double-click on the terminal icon, after which a window will appear in which you must enter your password and username.
Then click on the Login button.
Trading platform capabilities
In the advanced order management mode, there are customizable tabs of the quotes monitor, which are made in the form of spreadsheets. They allow you to create a personalized trading environment without unnecessary detail. There is a toolbar at the top of the window with quick access to specialized trade components.
Each tab of the quote monitor displays the main market elements for all traded products: bid / ask price and size, last trade price, close price, etc.
Enter the ticker symbol in the Contract column, select the instrument and direction. The market data line will be populated with real-time information.
Market data fields can be configured in the Global Configuration window. To do this, use the wrench icon.
The Position, P&L, and Unrealized P&L columns are available on any ticker row as real-time information for the position.
There is no limit to the number of tickers you can add, however, only 100 active quotes will be displayed at a time. Use the "+" tab to add new bookmark monitors to organize and sort your watchlists. Large lists can be imported from a csv file.
Additional panels of the quote monitor (for example, toolbar, button panel, etc.) can be turned on and off using the small icons in the panel on the right.
Column contents can be sorted by left-clicking on the column header. The first click will sort in ascending order, the second click in descending order, and the third one returns the original sort.
The ability to create header lines helps you organize the tickers on each page.
Hotkeys - Use Ctrl + H shortcut to access a list of ready-made hotkeys or to create / modify your own.
Context-sensitive help is available across the platform. To display a tooltip, hold the mouse cursor over an element of the program interface.
The menu displays actively used functions and features. If an arrow icon appears at the end of a drop-down menu, this means that there are additional options in this menu.
Menu items that have not been used in the last 14 days are hidden from the list of active options, but they are still available and can be shown in the list by clicking on the arrow icon.
Navigation
Search Box - Located in the upper right corner, it helps you find specific features and SHOWS how to access them. Enter a keyword (for example, "dashboard" or "toolbar") and you will see how the search engine will draw your attention to the desired menu or page and even visually bring the option you need closer.
Right-clicking the mouse opens a context menu, the content of which changes depending on where you clicked.
Right-clicking on a market data line allows you to start creating an order, find information on a specific contract, and also access trading and information instruments by selecting them from the context menu.
Right-clicking on an order line allows you to attach dependent orders, check the accompanying margin requirements for an order before submitting it, reconcile risks, or create “what if” risk scenarios.
By right-clicking on a column heading, you can switch between displaying values (for example, numerical value or percentage) or customize the fields that you want to see.
With the right mouse button, you can also customize cells, rows, buttons and more.
Trade
While the Mosaic functionality only supports basic order types, the advanced control mode quote monitor allows you to create and manage more complex trade options.
Use quick entry of orders to instantly create them with a left click on the bid or ask price in the active quote line. Pay attention to the text that appears when you hover over the bid / ask price.
The order line is displayed just below the market data line. The order line will be filled with the default values. You can click on any field to change it before submitting the order. Additional order fields can be added using the green "+" in the column header.
The order fields only show the choices that can be used for a given instrument and destination.
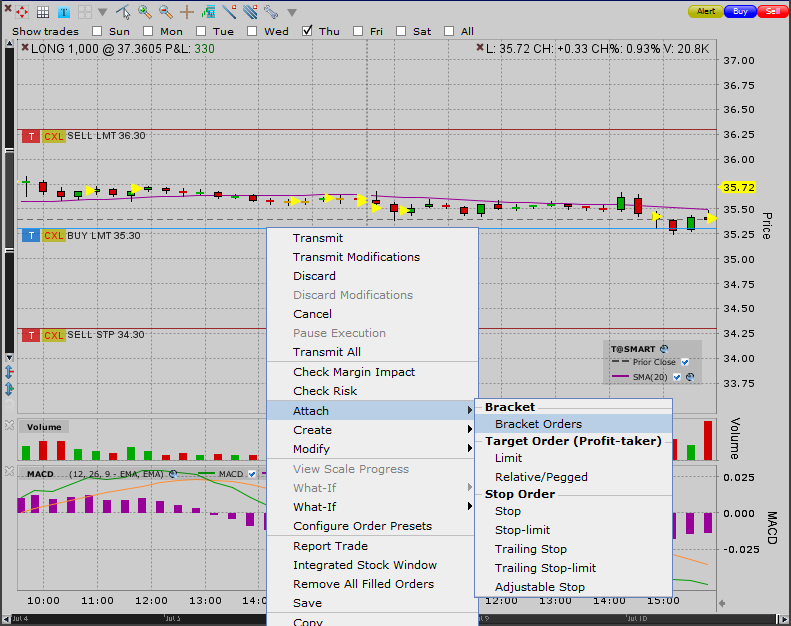
Right-click on the order line and select the Attach Orders option to create dependent orders. In this case, when the original order is executed, the associated successor orders are activated.
Automatic order - bracketing order, profit targeting, protective stop orders.
Hedging - pair trading, FX conversion and beta hedging
Combination orders can be created right in the contract field.
Algorithms - select "IB Algo" in the destination column, the order line will be expanded and you can enter the criteria for the algorithm.
The Order Types table contains descriptions of more than 50 types and provides access to the step-by-step creation of the required order.
The order preset feature allows you to set default values for your orders, and create and save many known strategies for an instrument or specific symbol (s).
Right-click on any ticker line and select Configure Order Presets. This menu is also accessible via Edit | Global configuration | Presets.
Specialized trading instruments are available from the toolbar at the top of the quote monitor or by right-clicking on the quote bar. These optimized trading functions with built-in order entry capabilities can also be accessed from the Mosaic interface> New Window> More Additional Instruments.
Alerts - Create alerts based on price movement, time and date, trade volume, execution, or the state of your margin cushion.
BasketTrader / Index Trader - trade a basket of individual components of the underlying as a single set of transactions and save it for trading at any other time. You can also choose an index-based basket order or define your own index parameters to create a basket.
BookTrader is an application designed specifically for market makers that allows orders to be immediately transferred via price steps to take advantage of instant trading.
ChartTrader - Use the ChartTrader app to create, transfer and monitor orders from any chart in real time.
Integrated Stock Window - A customizable stock management interface that combines deep book data, real-time charts and full order management in a single window.
Rebalancing - Simplifies the process of redesigning a portfolio to suit your investment goals and risk tolerance.
Market Depth - Displays an order book with traded volumes for each supply and demand level. This tool is necessary primarily for active traders or investors who need to see the prices of large transactions and the size of spreads.
Merge Arbitration - allows you to create combination orders for a predicted merger of two companies.
Each of the listed components functions independently of each other, but they still have similar elements, thereby allowing you to view market data, transfer and manage orders, monitor ongoing actions, check executions and changes in your investment portfolio.
Signals
Create signals using real-time market data and / or account metrics. In the Signals window, click the New button to set signal parameters such as price improvement, time and date, trade volume, or the state of your margin cushion.
This function sends a pop-up message, email or short message to your phone to your trading screen. Signals can also trigger pre-prepared buy or sell orders.
Conditions section - allows you to set specific requirements for triggering an
alert : Enter a symbol in the underlying box.
Specify the signal conditions, and in the "Operator" field select one of two options: "greater than or equal to" or "less than or equal to".
Specify up to three requirements, then select "AND" (all conditions must be met) or "OR" (any of the specified conditions will trigger a signal).
Actions section - here you specify the action that will be taken if the conditions are met. For example, sending a pop-up message / email / short message on your trading screen to your phone, or initiating a pre-set order.
Section Duration - the signal can be active until it is triggered or canceled. You can also select the period of time until which the signal will remain active by specifying a specific date and time in the corresponding column "Signal active until ...".
The preview displays a description of the signal conditions you specified.

BasketTrader
The BasketTrader app enables professional traders and investors to simultaneously trade a basket of individual underlying components that can be configured and sent as a complex execution order. Baskets are used in index arbitrage, program trading and hedging.
Creating a basket file A basket
order can contain several types of orders for different instruments, and also include any action time or attribute.
Start at the quote monitor and create orders for the basket file.
Note: when you create a cart file, you can only include contracts from the same trading page.
Edit the order criteria and set the required attributes. DO NOT SEND!
Next, in the Trades menu, select Save orders as "basket". The file is saved in the .csv format, which can later be opened in Excel.
Be sure to cancel the orders created on the quote monitor page. To do this, use the Trades menu and select Cancel All Orders on the page, as you will submit your orders via Basket Trader for complex execution.
You can also create and edit a basket file manually in another application (such as Excel), but the easiest way to create this type of file is by using a sample in TWS. In this case, when you save the cart file, you are left with a sample that you can later use as a starting point for adding your own header / order lines and cart components.
Submitting a Basket
Loading a basket order is as simple as selecting your edited file from the basket list at the top of the BasketTrader application.
Click the Browse button to locate the previously created recycle bin file.
Change the multiplier if necessary.
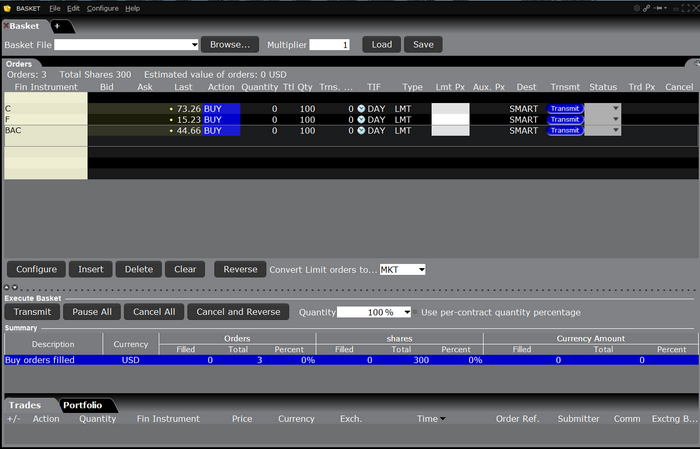
Click Load and the order panel will be filled with the details of the cart file you selected.
You can adjust the basket order before transfer by adding or removing assets, changing the multiplier or quantity, etc.
View the total number of shares and the estimated value of the basket order.
When you submit a cart order, each component of that cart will be executed separately. If your account does not meet the margin requirements, then there is a possibility that only part of the basket order will be executed.
You can automatically update the limit price for an order (or all orders) to match the bid, ask, close, or last price. To do this, in the "Edit" menu, select the "Update orders" option
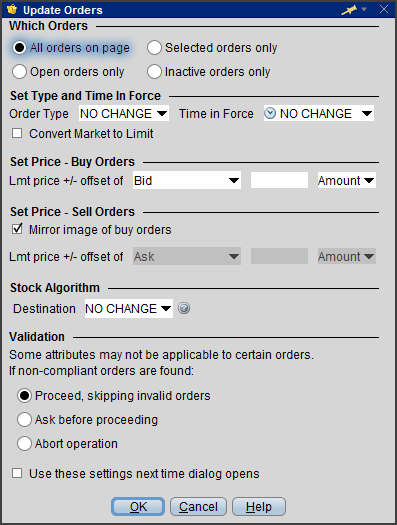
The Orders Panel displays a real-time summary of your basket, including the number of orders, the number of shares, and the estimated total value of all orders in your basket.
You can easily adjust the parameters for the entire basket at once or for each order separately.
Swap the side of an order or all orders with one click and keep the prices of updated orders at the appropriate level, automatically converting limit orders to market or relative with an offset.
Cancel unexecuted parts of the cart with one click.
The fulfillment panel allows you to set distribution criteria for controlling the quantity shipped.
It is also possible to set a percentage to apply to each order quantity, or specify a quantity to be equally distributed across all orders.
The Cumulative panel displays statistics for all order parameters, including total totals, executed quantity, and basket percentage for orders, stocks and currencies.
Index-based baskets
You can manage a standard basket of index-based stocks using index or statistical composition.
Open the BasketTrader app, click the Show Index Bar button and select IndexTrader from New Window> Additional Trading Instruments.
Start by selecting the desired index from the list provided. Use the different criteria to better customize your index basket.
Adjust the composition of your basket by filtering components based on volume, market cap, beta value, price or symbol.
If you decide to use an index composition as the basis for your basket, the system will automatically maintain the basket in accordance with changes in this index.
Click "Load" to display your index basket in the "Orders" pane.
The "Hide Index Panel" button will only show your basket in the order panel.
BookTrader
Designed specifically for market makers and allowing immediate transfer of orders via price steps, BookTrader in TWS has become popular with active traders, scalpers and those looking to benefit from instant trading.
This window displays the order registration system (the so-called order book) with volumes available for trading for each price level and allows you to create limit, stop and bracket orders with one click.
The price rungs are color-coded to quickly recognize information about current bid and ask prices, daily trading levels, order types and status.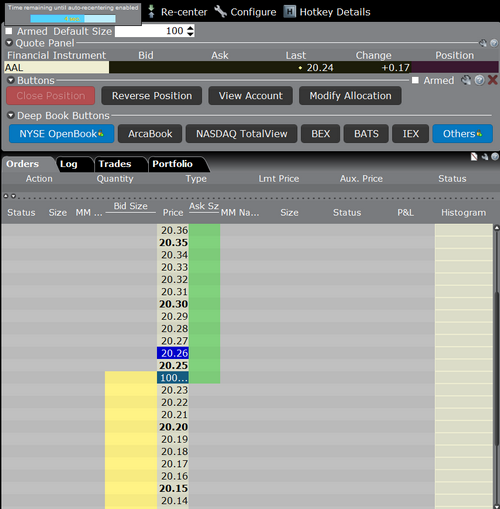
You can create orders by selecting the desired price row:
Click on the yellow Bbw column to create a BUY order, or the green Bid pb column to create a SELL order.
Left-clicking on a bid or ask size creates a LIMIT order.
Right-clicking on the bid or ask size initiates a STOP order. Note that the size field is also categorized by color: red for stop recognition and light blue for limit.
Bracket order - hold down the ALT key and left-click on the bid or ask size to create a bracket order.
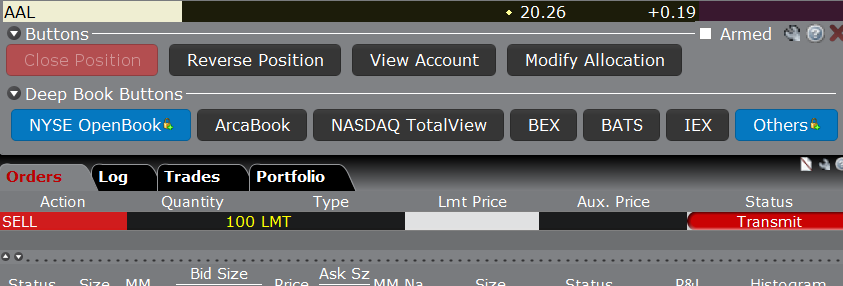
Orders are transmitted instantly. Working orders will be visible in the "Orders" tab in the activity panel, as well as in the main trading window on the "Pending" page.
Order Management Your choice in the BookTrader settings menu to display the status sets the order management procedures.
Use the Order Control settings section to set how TWS handles multiple orders on one side.
When the bid / ask size is selected at an empty price level and there is an order, you can:
- move an existing order (single order mode).
- create a new order (multiple order mode).
When the bid / ask size is selected at the price level with an existing order, you can:
- request cancellation of the existing order (single order mode).
- create a new order (multiple order mode).
When Show Separate Status Columns is selected, BookTrader is in Advanced Mode:
The Order column is created, in which all parts of linked orders (original and successor orders) are visible and available for modification.
Using the order type selection buttons, you can separately build inherited orders, only by specifying the price level for each dependent order.
These buttons override BookTrader's mouse click functions to create only the selected order type. For example, if you press the LMT button to select the order type, then any further clicking, even with the right mouse button, on any of the price steps will create a limit order.
To revert to the default click settings, select None from the options provided.
Click on the price level in the order column to attach the corresponding successor order. When you select a price level in the order column, the selected order is attached in this column to the original one.
Chart Trader
You can place and manage trades directly from the chart in real time using hotkeys that can be set in the View menu.
To create an order line, click the Buy / Sell button. The cursor will show a dotted line - blue for a buy order, red for a sell order.
Left-click on the appropriate price level to create an order.
The ChartTrader Order Control Panel will open allowing you to manage / modify / transfer orders.
Additional features such as attaching a bracket order or checking margin are available by right-clicking on the order line on the chart in ChartTrader.
You can also customize the display of your trades when you hover the mouse cursor over the chart details. This option is available in the Edit> Global Configuration menu. A thin red line indicates a sale, a blue line indicates a purchase at the price level of the transaction.
Integrated Stock Window (ISW)
ISW is a dynamic, customizable order management interface that combines Level I and Level II market data, real-time charting, fast order entry and complete order management in a single window.
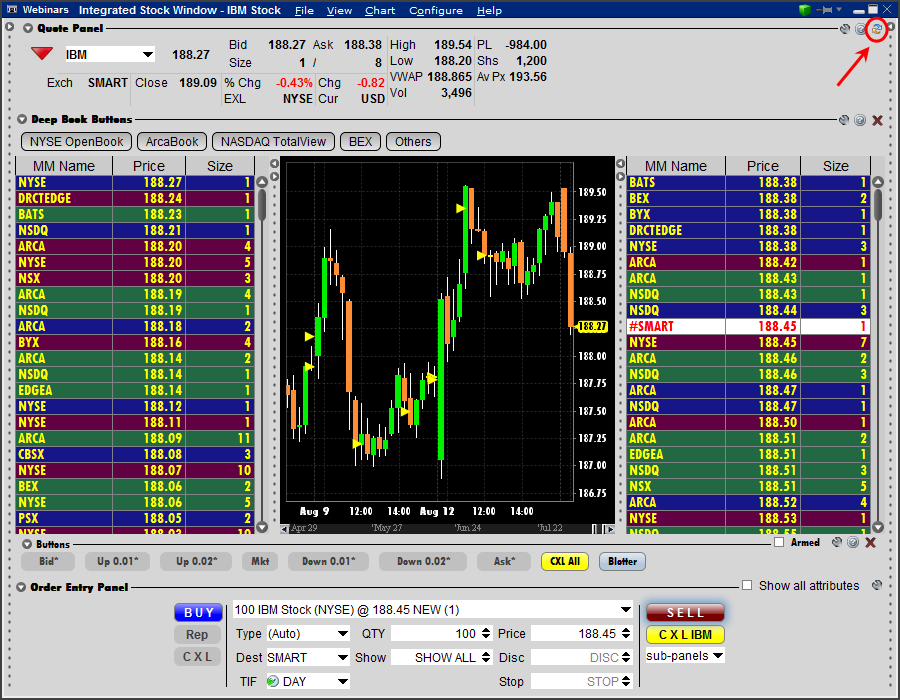
The types of orders include both basic types (for example, limit) and more complex algorithmic orders. Use the order entry panel, as well as its subsections, price buttons and convenient drop-down menus to select the desired functions.
⦁ The Quote Panel displays market data for the selected stock symbol.
The display of quotes can be switched, using the icon in the upper right tab, between two views - table or TWS.
⦁ Book Data Panels allow traders to see the prices of large transactions and the size of the spreads.
On both sides of the chart, Level I and Level II quotes are displayed in real time. Different colors indicate separate price levels and traded supply and demand volume.
⦁ The graph panel works in real time and gives access to the main functions with a right click of the mouse within the borders of the graph.
You can choose one of three chart options: line, bar or candlestick. Also, add volume, crosshair, trend lines, time bar, price histogram or customize the appearance of the chart.
The chart can be collapsed or expanded using the arrow icons at the top of the dotted lines on either side of the chart.
⦁ Order entry panel - to create and manage your deals. If the order has not yet been submitted, the order line will be labeled "New".
Specify a price or select a price level on the deep book panels. Your ACTIVE order will be displayed on a white background to show its relationship to the available data.
The subsections show a list (s) of all available attributes and more complex order types.
Algorithmic orders - use the order assignment list to select an algorithm and specify its parameters.
To submit the order, click the BUY or SELL button. Unsent orders in the order line are shown as "NEW", this label changes when the order goes into working status. Use the drop-down list to view / modify work orders.
To modify an order, select it from the list of work orders. After making changes to the order parameters, click the Retry button to request cancellation and replacement of the current active order with the modified one.
Market scanners
Market scanners automatically populate a previously selected trading page with market data for stocks, bonds, futures, and indices based on the options selected.
You can create your own scan for daily viewing, just leaving the specified scan parameters on the trade page, which will automatically bear the name of the header of the scanner. You can create as many "scanner" trade pages as you like by using the "+" tab and choosing the market scanner layout. For example, when selecting stocks as a tool, you can scan by sector, industry and category.
Fill in the fields from top to bottom and left to right, as the choices you make will determine the remaining fields to fill:
Select a tool in the left pane. Based on the selected instrument / location / filter criteria, the available market scanners will be displayed.
Select additional filters for better control of search results:
⦁ Use the "Add Filter" button for additional search functions, more detailed criteria will narrow the search results.
When choosing Option Volatility scanners, you also have the option to specify if it will be daily or yearly volatility.
Price scans are based on the trading price of the selected instrument, so if the user's base currency is EUR, then "price over 20.00" will mean a price over 20 EUR.
Price ($) - Converts all results to USD for comparison. This filter will be useful:
⦁ for products based on other currencies (not USD), where we convert the price to USD,
⦁ for global filters, where we need to use a single denominator to compare the prices of products traded in different currencies.
Search line ![]()
After entering the scan parameters, click the Search button to start the process.
Check the Auto Refresh checkbox to have TWS automatically refresh the scan every 60 seconds.
By clearing the checkbox for auto-update, you can start scanning manually using the "Search" button.
Use the "Restore" button to return all filters to the system default settings.
The maximum number of results dropdown menu allows you to select the number of contracts represented by the search.
The Edit button makes it easy to open, modify and restart your scanner.
Change the settings for your scanner or create a new one by opening a new page tab.
The data is refreshed every 60 seconds. Most scanners display 50 contracts, but you can also select a different number of results you want. The High Dividend Yield Scanner for US Stocks displays the top 750 contracts.
Portfolio rebalancing
The rebalancing window in TWS shows all the positions you hold and the percentage of each of them contributing to your investment portfolio.
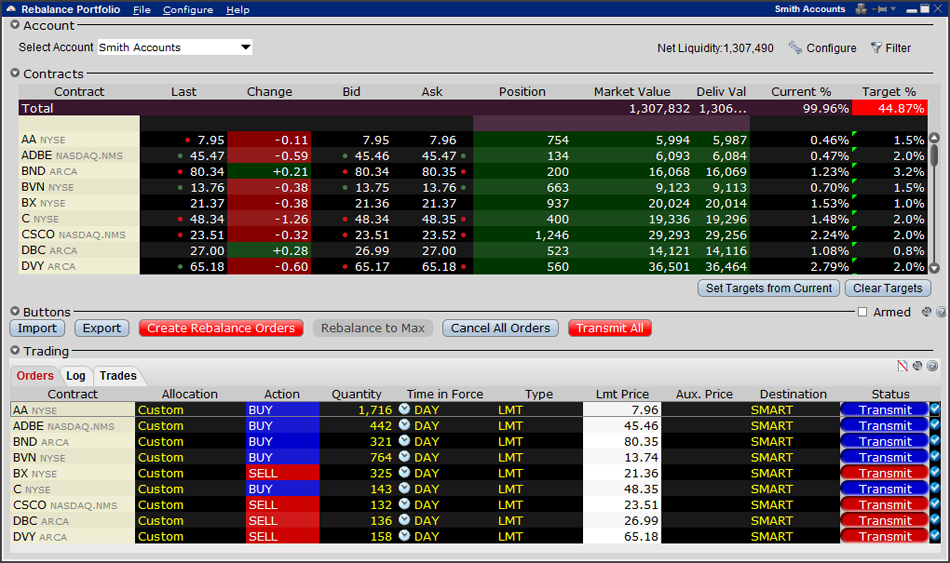
Use the Rebalance% field to specify a new percentage for each item.
The create orders button automatically creates buy or sell orders to rebalance your portfolio based on the new percent you specify.
⦁ NOTE: In the case of options and futures, the rebalancing percentage is based on the underlying prices.
Click the Create Orders button to initiate the TWS order creation process to achieve the desired percentage change.
Use the Submit All button to submit all orders, or click on the "T" label on the order line to submit only that selected order.
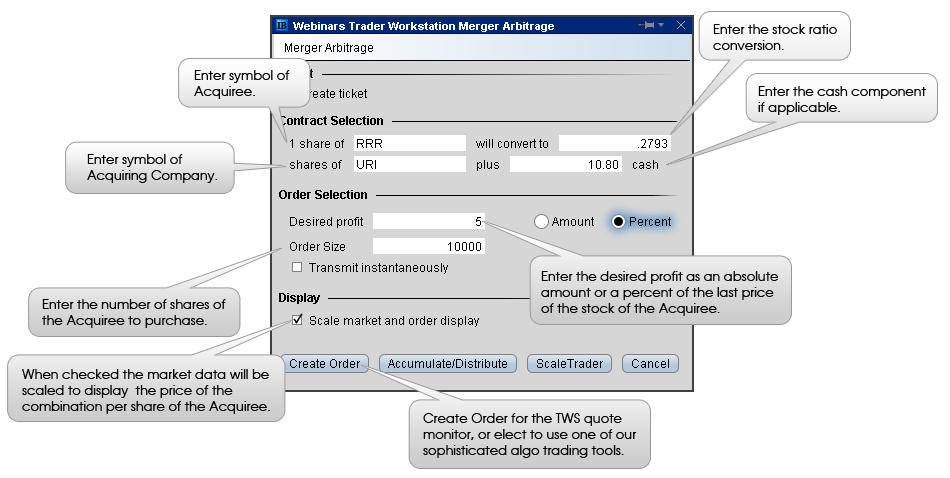
Merger arbitration
Use TWS's merger arbitration feature when announcing a merger or acquisition of companies. This trading tool allows you to quickly and easily create a combination order for a predicted merger of two companies from a single window.
A cash-in merger, in which one company offers to buy shares of another company at a specified price.
A share-for-share merger in which one company offers to buy another by exchanging its own shares for the shares of the acquired company.
Create an order on the Quote Monitor or set its parameters in more advanced TWS trading tools such as Accumulation / Distribution or ScaleTrader.
Example: RRR holders will receive $ 10.80 in cash and 0.2793 shares of URI securities.
Note: for the OK button to become active, you must fill in all the pink fields.
The above combination order, then opened in the Accumulation / Distribution application, will look like this:
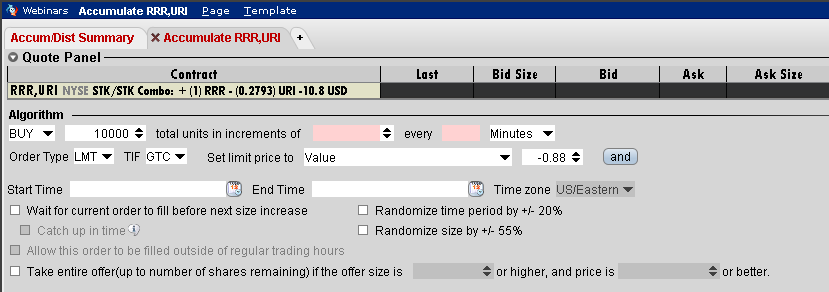
The rest of the Accumulate / Distribute window allows you to specify detailed criteria for processing an order in order to achieve the best possible price while remaining unnoticed in the market.
Market depth
The Market Depth window makes it easy to trade large volumes by using cumulative quantities and the available average strike price or better price.
Window components include real-time data of both levels (Level I and Level II), account and trade information, and improved order entry capability.
For the purpose of instant recognition, price levels are systematic by color.
Fast creation, modification and transmission of orders.
Displays Level I data from all available exchanges.
Access to Level II data by subscription. Use the Deep Book buttons to collapse or expand the data sources you subscribe to. The Others button displays Level 1 data provided by many exchanges.
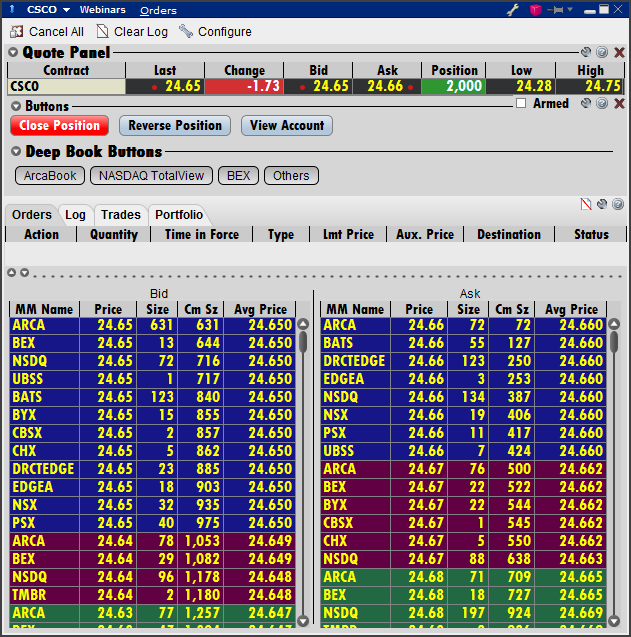
The aggregate size is the total size of contracts available at a specific price or better.
The average price is the average strike price received on a trade with the aggregate contract size. As your order goes through the order book, you get a lot of executions. The executed orders will appear in the trades panel.
Bonds
All orders and quotes for bonds submitted by participants are in the order registration system (order book). The following bond destinations are available using SmartRouting: Knight BondPoint, Tradeweb, Bond Desk, and NYSE Arca Bond. We are also connected to alternative bond trading systems, thus providing clients with access to multiple sources of liquidity. This improves access to liquidity, but it comes at an additional cost.
Each of the distant platforms has a different commission rate, which depends on both the platform and the type of bond and the quoted size, and can have a significant impact on the net price of the transaction.
As these fees may vary, you can choose to view bond quotes in a "net" price mode, showing the platform fees for the selected bond type and quoted size (excluding our fees). In Global Configuration> Display> Ticker Bar, if you select Fixed Income Pricing, you can specify either Show Net Price or Show Rough Price.
If you have a net price mode selected, an additional quantity field allows you to enter the quantity for which you would like to calculate net prices. This option allows you to see market data, expressed in net price, at the correct size for a trade, which will help you compare the cost of execution.
Charting and technical analysis at TWS
This powerful tool packs many features into one scalable, fully customizable charting window. Real-time charting is independent from other TWS tools, but nevertheless shares common features with them allowing you to track price variances and evaluate order criteria. . and market movement. Real-time line, bar and candlestick charts allow you to view data in a single stand-alone window for periods ranging from 1 minute to 1 year. View several charts at once, conduct technical analysis, add trend lines and place orders directly from the chart.
Access to real-time charts
From the Analytical Tools menu, select Chart.
In the Mosaic interface, additional graphical windows can be opened using the New Window button.
Select the underlying symbol and click on the "Chart" icon located on the toolbar.
Or right-click on the ticker line and select "Charts" from the list.
Chart options
You can customize the main components of the graphs in the parameters window. Users who open the graph window for the first time will see a standard set of parameters. The default settings can be changed to the options listed in the Edit menu.
The context menu items change depending on the options already selected, so always adjust your settings by moving through the menu from top to bottom and from left to right.
Specify the period and select what to show from the drop-down list.
Additional panels and tools are available.
In the "What to show" section, you can choose whether your chart will be linear or columnar. Bars and candles will become available if in the "Period" section you specify a time interval for bars.
By ticking the Skip this dialog when opening a new chart option, you will set the selected parameters by default. You can change these parameters by selecting Edit> Graph Parameters in the graph window.
Real time charts
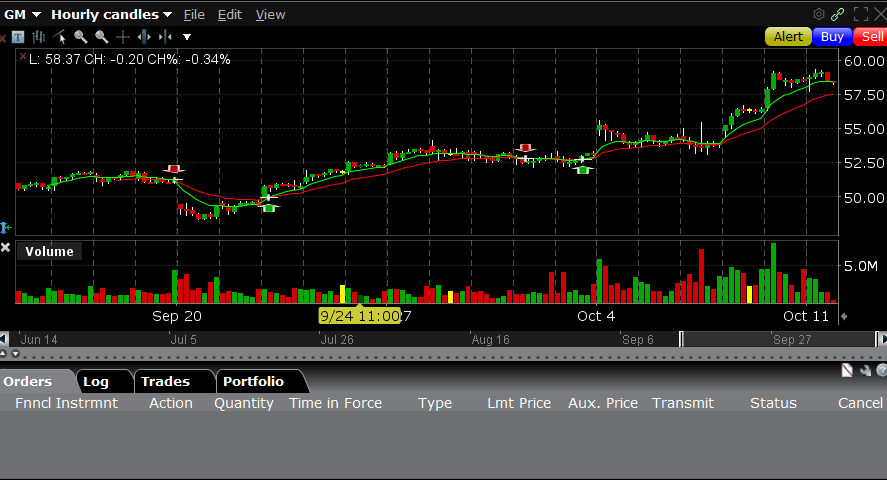
Real-time charts have been redesigned to be more spacious and simpler.
Indicator panel - to quickly change the underlying, the time period and the type of chart display. In the section "My Templates" you can apply the saved template or save the current schedule as a new template.
Grouped menu of commands - File, Edit, Annotate, and View.
Editable toolbar with shortcut icons for the most frequently used functions.
The Quote Zone displays relevant market data directly on the chart, rather than in a separate panel.
To configure, right-click on any of the quotation zones.
Map legend - located not at the bottom of the window, but in an unoccupied area inside the chart.
Right click to customize or turn on / off the legend.
Hotkeys - Hotkeys are disabled by default. To activate, enter the "View" menu and select where they should be added - on the toolbar or inside the chart frame. The Buy, Sell and Signal buttons allow you to create an order or price alert directly on each chart.
Click on any of them and your cursor will turn into a dotted line. Left-click on a suitable price level to place an order or set a signal.
The order control panel in Chart Trader allows you to change the criteria of orders and submit them for execution. If the panel is not visible,
Selecting "Quick Mode" activates one-click order placement.
Indicator panel
The timeframe section contains standard timeframe / bar combinations for quick configuration. After changing the default settings, you can instantly switch from one view to another.
Just click on the new time period / bar combination.
Create your own combination by choosing a new chart with a different displayed period or by setting a new period / bar pair.
You can save new parameter combinations by clicking on the "Customization Menu" link.
Available pairs will be highlighted; to remove any of them, click on the minus sign "-". To add a new pair, specify a time period / column combination and click on the Multilevel "+" sign.
Click "Save" to save your changes.
Automatic charts - consist of bars with a certain interval, without restrictions on the time period.
Templates - there is a section "My templates" in the drop-down menu of the indicator panel. In this section you can open a saved template or save the current schedule as a new template.
Menu items
File menu - allows you to save your settings as templates, open files with past charts and even place multiple monitors in one window.
You can reuse the format you like, including time periods, studies and markup, if you save it as a template and apply it to a new contract.
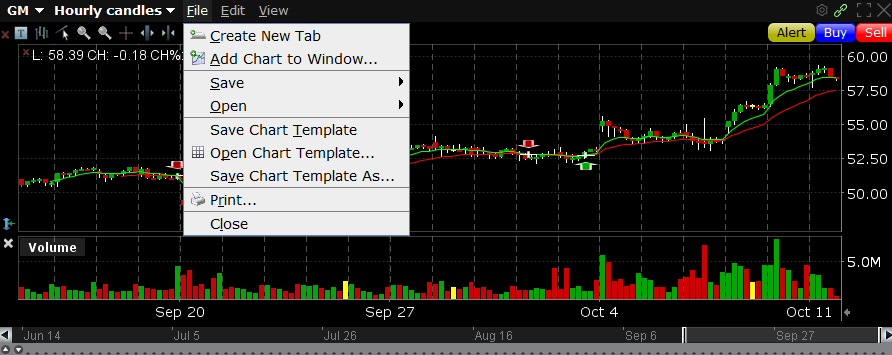
You can find files with past charts by clicking "Open". Move the cursor over the name of the file you want to work with or you want to delete.
Edit menu - the "Chart settings" contains the following tabs:

Chart parameters - allows you to customize the charts of any contracts, regardless of the currently open chart.
Research - gives a list of all available technical analysis tools.
Click on the required tool and click Add. The selected tools will appear in the window on the right. To set up the initial conditions for the analysis, go to the Edit section provided with drop-down lists.
If you want to add multiple studies, do not forget to click "Apply" before adding each additional study.
You can set the color that a particular instrument will be designated on all charts through the menu item "Global Configuration"> "Charts"> "Chart Colors", where there is a separate tab for "Research". If you set the selected color as global, then changing the color of this tool will be synchronized across all charts.
Minor Series - Plot charts for different tickers in one field.
Index Comparison - you can choose either from the popular indexes of America, Europe and Asia / Pacific, or from a general list of all available tickers.
Annotations - allow you to add trend lines, support / resistance, Fibonacci lines, as well as comments to any chart. Annotations can be easily edited,
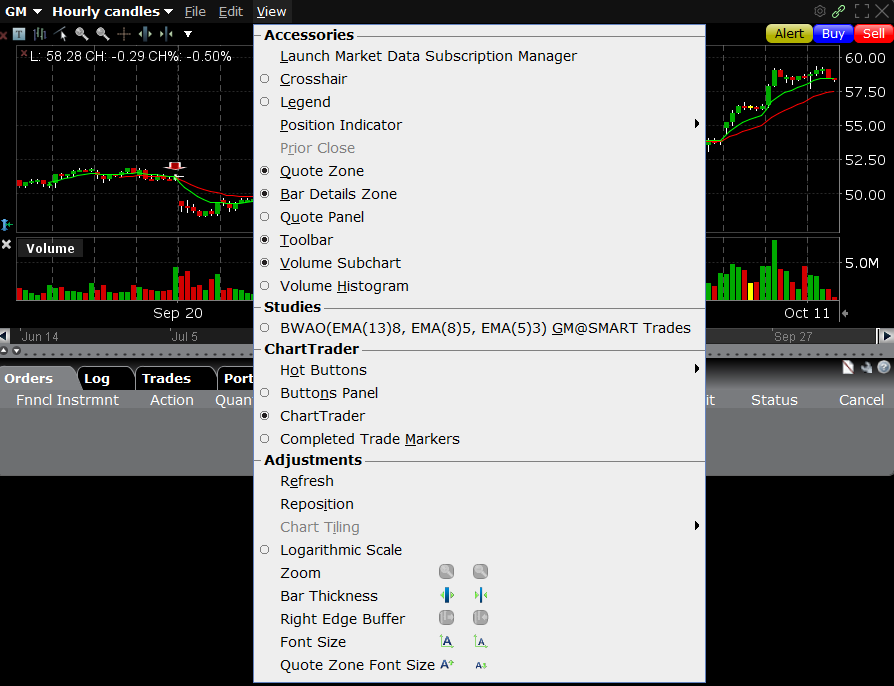
View menu - allows you to add / remove additional panels and tools. Check the functions that you want to see on the graph. To hide an option, simply uncheck the box.
Toolbar
Consists of icons for quick access to the most frequently used functionality. The function menu is as concise and organized as possible. Add to it only those tools that you use.
Click the down arrow and select Customize Toolbar.
The same functions and tools can be activated by right-clicking in the graph field.
Additional components
Scroll bars
Vertical scroll bar - moving the left scroll bar adjusts the visible price range.
If you move the vertical scroll bar, it turns yellow, indicating that the price axis is locked and the chart is not updating. Click on the yellow padlock icon at the bottom of the bar to unlock the price axis and restore automatic scaling and real-time price updates.
You can customize the visible price range in the menu Edit> Chart parameters.
The vertical scroll bar can be turned on and off in Global Configuration> Preferences.
At the bottom of the bar there is a small blue arrow (s) - you can use it to increase / decrease the vertical buffer.
Horizontal scroll bar - when you move the lower scroll bar, data is displayed beyond the specified time interval. The width of the bar depends on the start and end of the displayed time period.
If you move it to the left, you will see data for an earlier period than was originally requested.
By moving one of the ruler stops, you change the time period displayed on the graph.
Trend lines
Horizontal, vertical and freehand trendlines can be plotted on the chart by going to the Annotations section located in the Edit menu.
If you have multiple charts open for the same underlying, you can apply the same trendline to each of them if you enable the trendline sharing feature.
The Share with the same size bars condition allows sharing trendlines only among those graphs that are built with bars of the same size. (Note: Available when trend line sharing is enabled.)
Indent field
The movable indentation field allows you to move the chart to the left - a useful feature during trading, as it prevents the data on transactions from overlapping the chart.
If the "Indent" box is checked in Global configuration> Graph settings, there will be a small arrow pointing to the left at the bottom of the x-axis, which will allow expanding the right edge buffer.
Position indicator
A graphical position indicator is a line, field, or user-defined area that shows the average price of trades with an existing position and is directed upwards for long positions or downwards for short positions.
Right-click and tooltips
Additional contextual functions and tools are available by right-clicking. Hints appear when you hover the cursor over the software accessories you are interested in.
Hover your cursor over a bar or candle to check the corresponding price values.
Right-click, click the down arrow to expand the list, and select Time & Sales.
Right click on the legend to display other functions.
Right click on an empty spot inside the chart to see a list of available instruments.
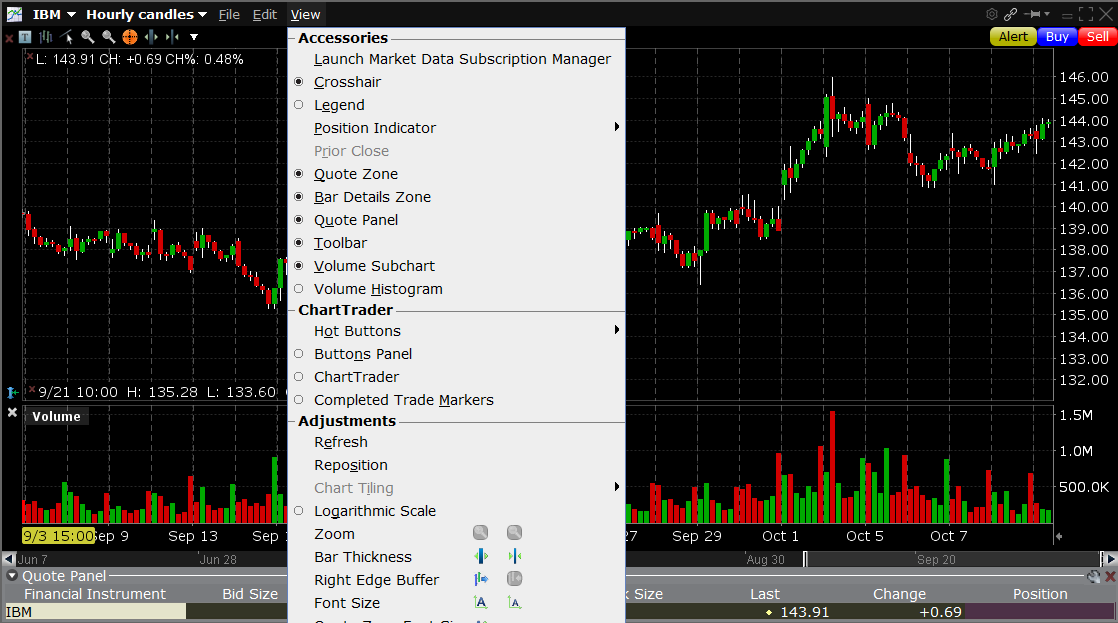
Accessories
Accessories (eg Crosshair, Position Indicator and Volume Histogram) can be turned on / off in the "View" menu.
Additional functions can be activated in the Chart Options:
News alerts marked with yellow arrows contain the latest headlines and are provided with tips.
My trades display completed trades directly on the chart, at the intersection of the corresponding price and time. There are hints for your reference. Red lines represent sales, blue lines - purchases.
ChartTrader
ChartTrader hot buttons allow you to place orders directly on the chart.
Click on the "Buy" / "Sell" button to open the order entry line. The cursor is equipped with a dotted line - blue for buy and red for sell.
Left-click on the appropriate price level to create an order ticket.
The order control panel will open to change the criteria / transfer the order.
Additional features such as attaching a bracket order and checking margin are available by right-clicking directly on the order line on the chart.
ChartTrader
Order Control Panel Tabs: Orders - contains TWS order control fields.
Trades - stores information about executed orders.
Portfolio - shows available positions and their un / realized P&L.
Many charts in one window
You will be able to observe several charts in one window if you give the command File> Add Chart to Window in the menu.
By default, the same underlying asset is applied to new charts. The rest of the parameters can be changed manually later.
Additional charts can have different time frames, studies, etc. Multiple charts mode - up to 16 charts can be placed in one window at the same time.
Individual charts can be made full screen and collapsed by double-clicking on the title bar.
The toolbar and menu options only apply to graphics with an active title bar. To activate a graph, just click on it.
Charts for the same ticker symbol can be saved as templates.
Charts for different ticker symbols cannot be saved as a template, but you can save them in the definition file format to reopen if necessary.
Group blocks
Group blocks are especially useful if you have specific chart types that you would like to use for all watchlist tickers.
Click on the colored cubes on the title bar of the TWS windows you want to combine with a single ticker. Windows marked in the upper right corner with cubes of the same color will simultaneously update data for the same ticker.
Make sure that all the required windows are marked with cubes of the same color.
Then click on the pin icon to pin the chart window over the trading window, and select a ticker symbol in the trading window - you will immediately see how all the grouped windows will update based on the selected ticker.
Press the DOWN ARROW on your keyboard to see the same chart for each ticker in the watchlist.
- Pin icon
Click on the icon to keep the work area in front of all windows. Click again to disconnect.
Creating templates
You can reuse the template you like with a suitable time interval and other parameters, as well as with the necessary analysis tools and indicators, if you save the chart as a template and apply it to other contracts.
To do this, select Save Chart Template from the File menu.
Give the file an easy to remember name - do not change the folder location and tpl extension.
The Replaceable field must be checked so that the template can be applied to any ticker.
To create a chart layout based on a saved template, in the "File" menu, click "Open chart template" and select the required one.
Saving charts
When adding ticker symbols in multiple working charts mode, you should Save> Chart. The result is not a template, but a definition file. To open a saved chart, go to "Open"> "Chart" in the File menu located on:
Docked Mosaic Panel.
In Advanced Order Management (legacy TWS).
In the window menu of a single or multiple charts.
Combination charts
In order for TWS to chart across multiple legs, you need to indicate that you want to chart for that particular combination. Due to the need to track multiple streams of market data, charting of combinations can be slow.
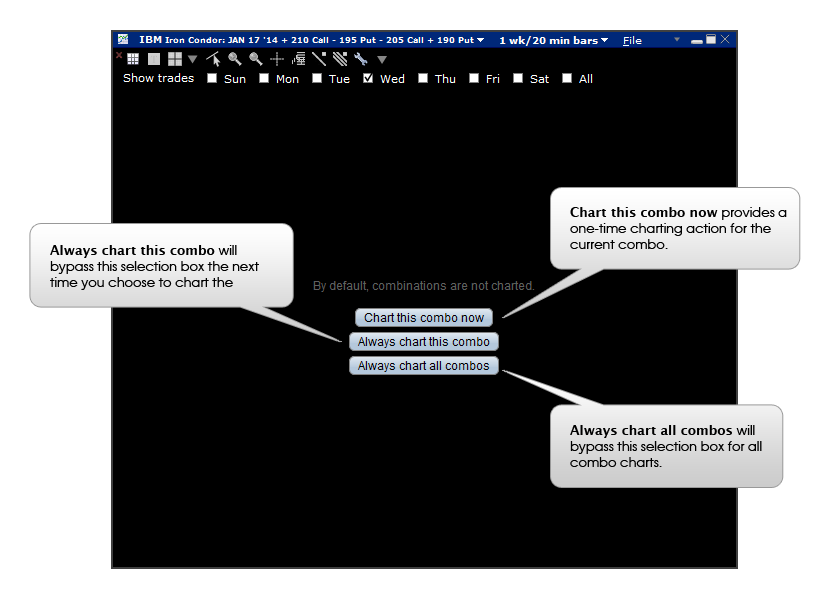 When specifying a command for a combination of contracts, indicate whether you want to plot a graph for the selected combination only once, each time you select it, or always for any combinations. By design, the tool lacks the function of plotting combinations, as queries for data over many legs can slow down the system.
In the quote monitor, add the market data line for the combination.
Right-click to open the menu, where select "Charts", then "New Chart".
Set the schedule parameters and click "OK".
Decide how you would like to plot the combinations.
Financial Markets Scanner
TWS Market Scanners allow you to quickly and easily scan global markets and find the best performing contracts in America, Europe and Asia, including stocks, options, futures, US corporate bonds, indices and other products. The scanners available are based on your choice of instrument and world region, and give you the ability to set your own filtering options.
Scanners are available in all trading applications:
Both through Mosaic and through Advanced Order Mode in Trader Workstation.
Any combination of search criteria can be configured in the scanner: such as instrument type, market center (s), price and volume limits, sector, industry, etc. You can even create templates to easily launch your favorite scanners as needed.
The scanners will automatically populate the list of quotes with the best contracts based on your chosen instrument and filtering parameters. Rank company performance from best to worst by choosing your fundamental or technical criteria. These dynamic windows allow you to search for potential trading opportunities in real time.
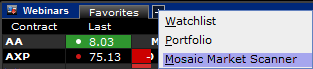
Mosaic Market Scanners
- Ready scanners
Create, configure, edit and view market scanners through the Mosaic workspace in TWS. Click the "+" icon on the top bar of the watchlist and select the Mosaic market scanner.
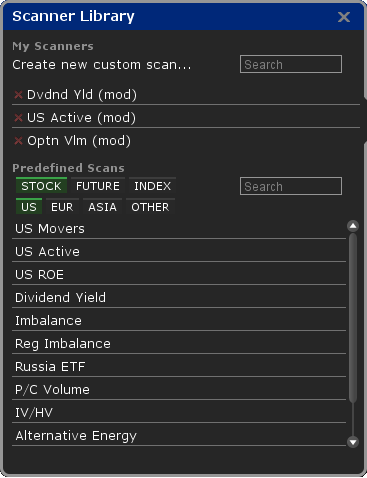
The scanner library includes many ready-made scanners, as well as the ability to set your own scan parameters. Start by choosing an instrument (stock, futures, index) and region (USA, Europe, Asia). As you customize the Scopes, your selections will be highlighted in green.
Use the Settings button to open the Fields and Filters section, where you can set the Display and Sort options for the scanner. The Add Field drop-down menu allows you to select which additional market data fields will appear in the scan results. Drag and drop the field names to change the order in which they appear in the scan results. In the Display column, you can choose how the fields are displayed. Use the Line, Column, or Gradient graphical indicators to visually display information.
Gradient - helps in finding companies that exceed several established scanning criteria; looks like a colored circle with different shades to display field values. Hover over the gradient to see the color legend.
Column - Direction and changes are displayed in colored columns. Red indicates negative and green indicates positive.
Line - values are displayed with colored lines.

Use the Filter button to graphically define the filter frames, or enter the values on which to filter the results. The Sort field allows you to specify whether the scan results will be sorted in ascending or descending order. Double sorting divides the results into two columns: in one they are ordered from maximum to minimum, and in the other vice versa. Both of them appear in the scan results.
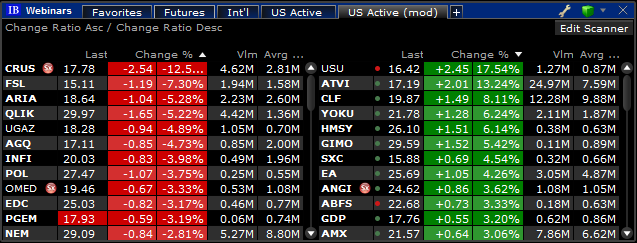
Click Finish to finish scanning. In the upper right corner of the window is the Configure Scanner button, so you can change your settings. Scan results can be exported to Excel.
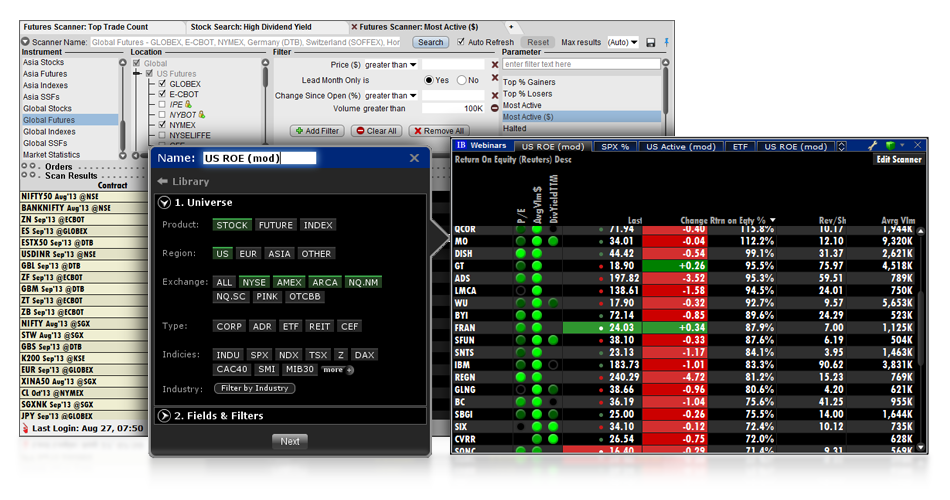
Creating a custom scanner
After clicking on the "Create Custom Scanner" button, enter a name for your scanner. Then, under Scope, select Product, Region, and Stock to start creating your scanner. Note that the scanner is already starting to line up in the watchlist window while you select fields. Additional options appear based on your selection. For example, the stock scanner allows you to filter by stock type, narrow the results down to specific index components, and even filter by industry, sector, and category. Open the Fields and Filters section to add or remove additional fields. Field names can be dragged and dropped to rearrange the column order.

The scanners you create will sit above the finished scanners in the Scanner Library window, allowing you to easily launch them when needed.
Double-click an empty spot in the watchlist header pane to expand the scan window and view the full results. Double-clicking the same panel again returns the window to its original Mosaic view.
Scanner columns can be sorted by clicking on the column headings - the arrow next to the heading shows the field and sort order for the scanner.
Expanded Order Mode TWS
Market scanners can be added using the “+” sign in the Quote Monitor to create a new tab via the Analytical Tools menu.
Please note that when you open the scanner through the menu of trading instruments, the icons allow you to choose how the scan results are displayed: in a separate window or as an additional tab on the quotes monitor.
Displaying in a separate window is limited to the number of active tickers (100) showing quotes in real time. You can limit the number of scan results via the "Max. Results" drop-down menu.
Create your own scanner that you can check every day, just by leaving the tab with it open on the tab of the quote monitor. You can create as many scanner tabs as you need.
Customize your scanners by adding additional market data fields.
Move from top to bottom and from left to right, because your choice will be based on the next available options:
First, select a tool in the panel on the left. The choice of scanners changes according to the selected tool. The tab name reflects the selected criterion.
The available scan options vary depending on the instrument / location / filter you select. For example, when selecting stocks as a tool, you can scan by sector, industry and category.
Select additional filters for better control of search results: The scan is based on the trading price of each selected instrument, so if the user's base currency is Euro (EUR), then "price over 20.00" will mean a price over 20 EUR.
Use the Add Filter button to view additional filtering options.
Set more precise criteria to narrow your results. For example, you may want to see only the Top Growth% of US stocks in a certain P / E range or with a capitalization above 2,000,000,000. The
scan is based on the trading price of each selected instrument, so if the user's base currency is Euro (EUR) , then "price over 20.00" will mean a price over 20 EUR.
Each column of scan results can be sorted by left-clicking on its header.
Price ($) - converts all results to US dollars (USD) for comparison. This function will be useful: for goods based on other currencies (not USD), where the price is converted to USD, and
for world filters, where we need to use a single denominator to compare prices of goods in different currencies.
Click on the "Search" button to return a list of contracts that best meet your criteria. Save your search parameters as a template using the disk icon so you can access this scanner at any time.
The data is refreshed every 60 seconds. (Scan Time field)
Most scanners display 50 contracts, but you can also select a different number of results you want.
The High Dividend Yield Scanner for US Stocks displays the top 750 contracts.
Save your search parameters as a template using the disk icon so you can access this scanner at any time.
If you select a location without a subscription, a message appears advising you to either subscribe or remove unsupported filters.
You can open multiple scanners in your quote monitor simply by adding a new tab, clicking the "+" button and choosing Market Scanner.
Search line
![]()
After entering the scan parameters, click the Search button to start the process.
Check the auto-update checkbox to have TWS automatically update the scan every 60 seconds. If this field is not checked, the displayed data will be static. Use the "Search" button to quickly update the results.
Use the "Restore" button to return all filters to the system default settings.
Drop-down menu Max. number of results allows you to select the number of contracts presented by the search.
The Edit button makes it easy to open, modify and restart your scanner.
Change the settings for your scanner or create a new one by opening a new tab.
Option volatility scanners
Option price data provides information that can help predict market sentiment. For example, perceived volatility symbolizes the uncertainty about how markets will view future price movements.
TWS has 13 scanners that will display options volatility scores for the highest / lowest volatility rise or loss; contracts that are "hot" in terms of the volume of options; put / call ratio, and many other indicators.
Select Stocks as an Instrument,
Set filters (for active trades in stocks with limited volume).
Scroll through the scanner options drop-down menu and click on one of the available volatility scanners.
Select either Daily or Annual volatility.
Activate the Statistics panel in TWS OptionTrader to view scan values for specific underlying underlying assets.
US corporate bonds
The US Corporate Bond Scanner includes filters and parameters needed by bond traders.
Please note that before you can trade bonds, you need to extend the fixed income trading permissions in Account Management. Selective subscriptions are available for quotes on US bonds, Moody's' Ratings and Cusip.
Set optional filter values for quantity, price, or income.
Filter issuers by presence / absence of certain keywords.
Set more specific criteria, such as maturity, timeframe, or ratings, to narrow your results.
Select the checkboxes to query or exclude any industry-specific bonds from the search results.
Click Sort on the scanner toolbar to choose how the results are displayed.
By default, results are sorted from longest to nearest maturity. They can also be sorted by coupon rates, earnings, spreads between current bid and ask prices, ratings, hot commodities, daily volumes. Reuters fields may also be useful to you.
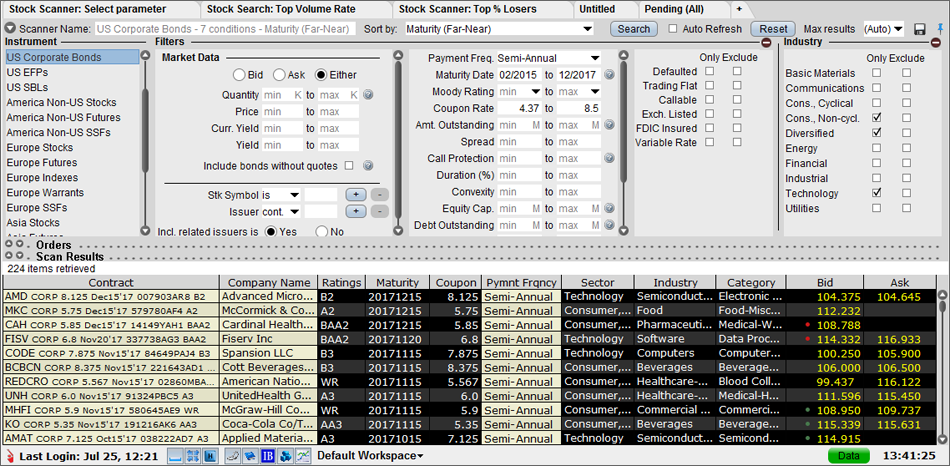
When looking for specific corporate debt securities, look for two fields at the bottom of the market data column to help distinguish between bonds.
The stock symbol is a useful field, but it does not always display all available bonds.
Issuer field - unites all issuers under a common company name.
Scanner Brief Post-Close Report
Most TWS market scanners can be used after trading has ended (including extended hours).
Post-close scanners use data from previous closes to generate a static summary of the closing market price. The scanner displaying summary report data can be identified by the gray background of the screen.
Market statistics, TICK and TRIN indicators
The following data are available for AMEX, NASDAQ, and NYSE:
Rising Stocks, Falling Stocks, and Unchanged Stocks.
Volume up, Volume down, and No change in volume.
TICK - this indicator shows the number of shares that are trading up minus the number of shares that are trading down.
TRIN - Trader's Index is a technical and analytical indicator calculated by dividing the rise and fall spread by the number of ups and downs.
Company indicators
TWS Highlights include multiple market scanners, allowing you to compare similar firms to your chosen ticker by category, sector and industry. If you are a subscriber of the Reuters World Core Metrics, you can add additional fields for scanners through the Global Configuration window.
Similar products
TWS provides several customized scanners for companies with similar industry / sector classifications. To search for Similar Products, use the corresponding drop-down menu on the toolbar.
Choose between the most active players, the growth leaders, and even look for the highest dividends.
Add other basic fields to the scan results using the wrench icon.
Sort the contents of the columns by left-clicking on their headers.
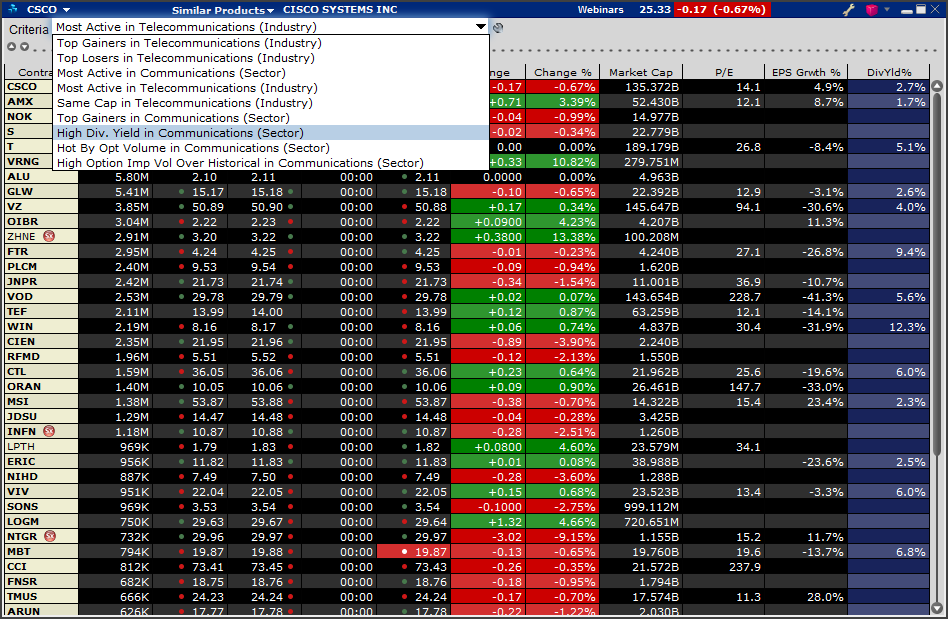
Market scanner pages can be customized by modifying the following Reuters fields in the Global Configuration window: 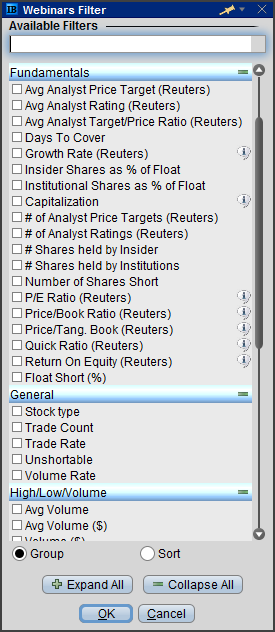 Growth Rate.
Price / Earnings Ratio.
Liquidity ratio.
Dividend income.
Return on equity.
Price / Balance Ratio.
You can create and manage orders from the list of scan results by clicking on the bid / ask prices to create an order line where you can select order parameters and submit it. Click on the bid for a sell order or the ask for a buy order. Standard control panel for orders with separate tabs: "Orders", "Journal", "Deals" and "Portfolio", available in the section of market scanners.
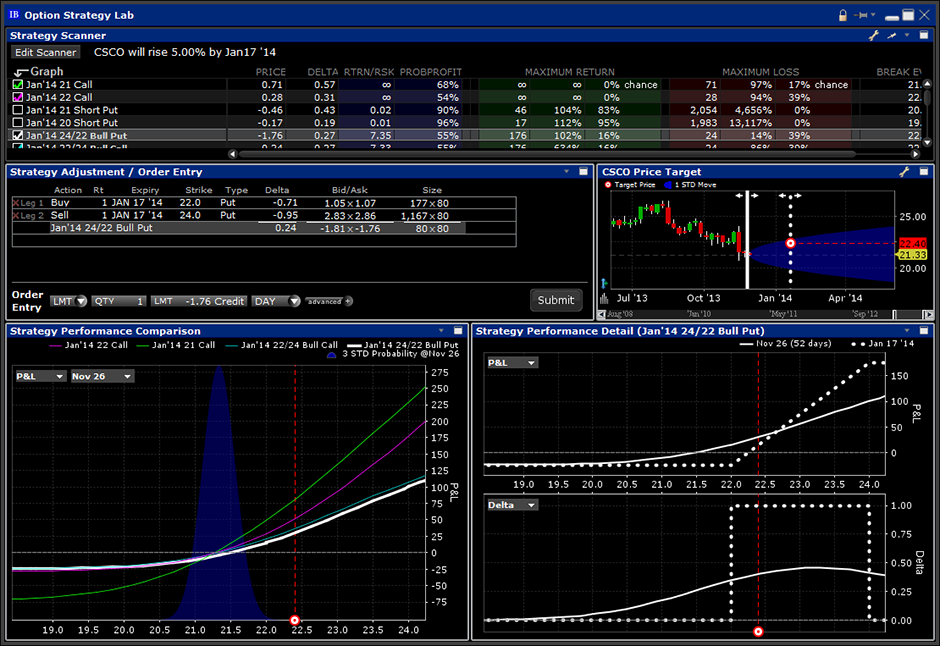
Option Strategies Laboratory
The Option Strategy Lab at TWS allows you to evaluate numerous sophisticated option strategies tailored to your underlying forecasts. Plug in your value for a stock or ETF and TWS will display options strategy options that are most likely to have a favorable outcome according to your predictions. You can analyze each potential strategy in order to find the one that will be available at the best price, with the highest risk and reward ratio, with the maximum profit or minimum loss.
Option Strategy Lab App for Complex Orders
There are many options strategies available to traders. The Option Strategy Lab at TWS helps you evaluate numerous sophisticated options strategies tailored to your underlying forecasts. Substitute your value for a stock or ETF and TWS will display options strategy options of your choice.
This innovative tool with built-in worksheets and charts allows you to quickly and efficiently compare and analyze different option strategies based on expected profit / loss or probability of profit. You can adjust the date, price or volatility of your forecast in order to find strategies that will help reduce the level of risk or increase profits at a certain stage of the forecast.
Access to Option Strategy Lab
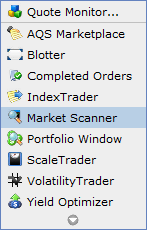
From the Mosaic interface, open the Option Strategy Lab application from the New Window menu.
In Advanced Order Management mode, you can find the Option Strategy Lab app under the "Trading Instruments" menu.
Strategy Lab Components
When you have your forecast for a particular stock:
You can either buy or sell the asset;
If you are a more experienced investor, you could buy a call or sell a put option;
If you are a veteran trader, you can also create a combination of option trades to benefit even more from the forecast.
You can use strategies to try to reduce the level of risk or increase your profit at a certain stage of the forecast.
Strategy Scanner
Enter your forecast for the underlying asset and indicate the forecast date. Then indicate how you would like to organize the results: by price or volatility, or by whether the given value will increase or decrease in price, remain in the same price range, or change in percentage terms.
If necessary, you can add filter (s) from the dropdown list, for example by premium type (debit / credit only), delta range, strike or expiration.
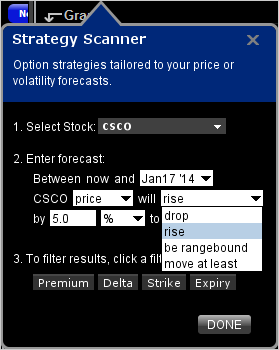
After filling out your forecast form, click DONE. TWS will display options for simple as well as complex option strategies tailored to your predictions. Then, you can review the strategies presented to check the probability of profit or assess the potential risk of each of them.
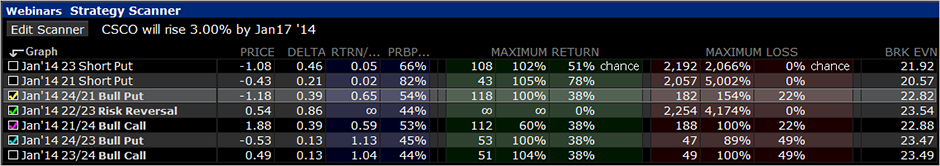
For each strategy, the scanner columns display the following fields:
Price - positive price means debit / negative price means credit.
Delta is a coefficient that compares the change in the underlying price and the corresponding change in the price of derivatives.
The risk / reward ratio is the value of the maximum profit divided by the maximum loss.
The implied market probability of any profit.
Maximum profit and maximum loss columns: Break-even point (s).
Max. probable profit / loss of the strategy.
Max. income% - shows the maximum probable profit / loss as a% of investments.
Maximum profit / loss probability - the estimated market probability of the maximum potential profit / loss.
You will see four strategies marked with different colored checkboxes. These colors correspond to strategy lines on each of the following charts: target price, comparison of strategy effectiveness, and detailed overview of strategy effectiveness.
Click on any strategy line to display it on each chart in the Strategy Lab application.
Up to four colored lines can be displayed on the "Strategy Performance Comparison" chart model. A strategy that is not indicated by any color appears on the chart as a fifth white line. This fifth strategy graphic line will be carried over to the selected strategy.
Choose any strategy you like. Put a check mark in the scanner window, and the color of the selected strategy will change to one of four colors, which will then be displayed for comparison on the charts in the built-in windows.
Let's look at these windows in a clockwise direction.
target price
The Target Price chart shows the price history and the predicted target price, as well as graphically depicts movement in one standard deviation from today's price. The solid line shows the P&L as of the current date, the dashed line shows the forecast date. The target icon indicates at what stage the target price is falling. (The current underlying price is highlighted in yellow and the target price based on your forecast is highlighted in red.)
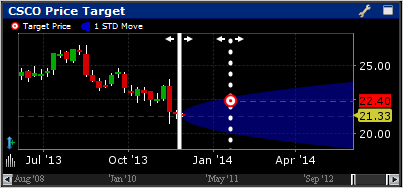
You can move these lines on the graph, and the corresponding "as of" dates change in the performance detail view. Thus, depending on the location of the price and the movement by one standard deviation, you can estimate how correctly your forecast is made.
Detailed overview of strategies' effectiveness
Shows the selected strategy in two plots of detailed performance overview where you can compare P&L as well as delta, gamma, vega, theta and Rho values. Due to the fact that the P&L curve for an option strategy changes over time, two lines are displayed on the chart: the solid line shows the risks at a given moment in time, and the dashed line - at the expiration. Use the drop-down menu options to adjust the risk comparison.
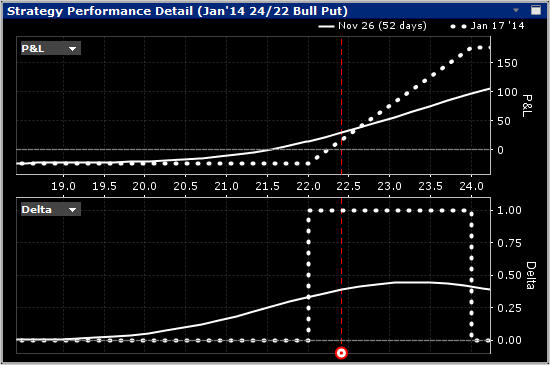
Comparison of the effectiveness of strategies
This graphical model displays the movement in three standard deviations for each of the selected scanner strategies (the color of the line corresponds to the colors of the checkboxes in the scanner table). Also, by clicking on the line of any unselected strategy, a fifth white line can be added to compare the effectiveness. The checked box will set the line color for this strategy.
Select a risk factor from the dropdown list and all strategy lines will be updated. Select a date from the drop-down list to view strategies for any period from the current moment to the point of your forecast.
Adjustment of strategies and entry of orders
The Adjust Strategies window displays the details of the currently selected strategy.
You can adjust the strategy by changing the entered parameters in the section for creating strategies. Changing one of the fields (action, expiration, strike, etc.) will create a new strategy row in the scanner table, below the strategy you are analyzing.
You can study the strategy based on your forecast using any of the Strategy Lab charts. To delete any additional strategy you created, click on the red “X” to the right of the checkmark in the scanner table.
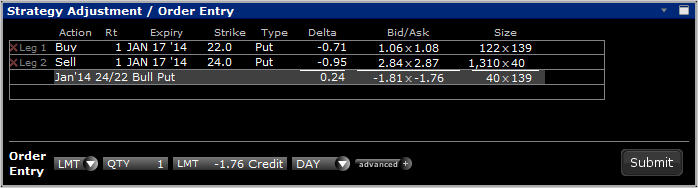
Once you have decided on a strategy that suits your risk tolerance, you can send orders directly from the Strategy Lab application. Edit any order entry fields directly in the Strategy Lab and submit them to the exchange. Use the "Advanced" button to add a stock leg or make the spread delta neutral.

About TWS
- BasketTrader and basket trading in the Trader Workstation platform
- ComboTrader spreads and option combinations
- OptionTrader and options trading in the Trader Workstation platform
- ScaleTrader Orders in Trader Workstation Platform
- Working with BookTrader in the Trader Workstation platform
- Accumulation / Distribution Algorithm for Stocks in the Trader Workstation Platform
- Forex Trading and FXTrader Features in Trader Workstation Platform